
- You are here:
- Home »
- Blog
How To Stop Emotional Spending
 The following post is by MPFJ staff writer, Catherine Alford. Cat is a freelance personal finance writer who blogs at www.BudgetBlonde.com.
Emotional spending is when someone, fueled by a particular impulse, feels like they have to shop. It can be something as complicated as getting into an argument with a spouse and spending a fortune at the mall or something as small as going to get a manicure just because you’re bored.
While spending money is not necessarily a bad thing in moderation, it’s important to be mindful of emotional spending since it’s one of the easiest ways to get your finances off track.
Below are some of the most common thoughts that emotional spenders have and tips on how to combat them.
1. I’m bored.
You know the drill: It’s the weekend. You don’t have to work. You don’t have any plans. So, you head to the mall and start browsing. Pretty soon, you’ve spent $200.00 on shoes and have to face the reality of a credit card bill a few weeks later.
Solution: Identify the cause of your boredom. Are you bored because you don’t have any plans for that day? Call up your friends and make some! Are you bored because you finished all of your work? Then, by all means, take a nap, watch a movie, or enjoy a glass of wine to reward yourself. Essentially, this emotion is all on you. You can’t rely on others to keep you entertained. Do the things that you enjoy when you’re bored, whether it’s reading a book or watching your favorite TV show, and stay away from the malls.
2. I’m feeling down.
I can definitely understand why many people shop when they are down or depressed. That small moment when you get to put a new skirt in a shiny new shopping bag can definitely lift your spirits. However, this is a dangerous habit to get used to, since your automatic response to every crisis will become shopping.
Solution: Whenever you are feeling down and want to shop, ask yourself if shopping will make you feel better long-term. Sure, you might get exhilarated by finding something great on sale, but will your happiness last after you go back home? If the answer is no, take some time to tackle the real issue and try not to mask it by swiping your credit card.
3. I want to celebrate!
I definitely think it’s important to treat yourself when something great happens like a promotion or your birthday, but many people who are prone to emotional spending turn everything into a celebration.
Solution: It’s great to acknowledge when things are going well and even more fun to reward yourself. However, if you are on a budget and are trying to stop emotional spending, try treating yourself to a cozy night at home or a nice bubble bath instead. Even better, have a picnic outside with your significant other or take your kids to the park. Essentially, special treats don’t have to cost anything!
4. I’m really angry.
This emotion applies mostly to relationships. Often times, couples will get into arguments, and one will go shopping just to spite the other one. Or, a college student might get mad at their parents and swipe their parents’ card just to prove a point. All of these behaviors aren’t going to make anyone feel better in the long run, and it’s best to avoid them.
Solution: If you feel angry enough to shop till you drop, first take a deep breath and try to calm down. Usually time alone to think through the problem will be enough to quell your shopping craving. You can also remind yourself that shopping won’t fix the issue at hand. Only talking through problems and working on major issues will help you in the long run.
5. I want that right now!
Impulsive emotions are definitely the riskiest form of emotional spending. Seeing something that’s awesome or interesting and buying it on the spot is okay from time to time. However, if it becomes a habit or you never deny yourself anything, it can definitely hurt you financially.
Solution: Tell yourself no as often as possible. Whenever someone asks me for my number one piece of financial advice, that’s what I tell them. Every time you say no, you are saying yes to a bigger savings account. Ask yourself if you really need the item in front of you or if you are just buying it because you like the way it looks.
Essentially, emotional spending is something everyone struggles with, and it’s important to know which type of emotional spending you most likely experience. Once you know which one sparks a need to shop, you can better tackle that issue head on. Remember, shopping is great for a little bit of temporary happiness, but once that fades, the problem you were running away from is unfortunately still there.
How about you all? Are you an emotional spender? How do you try to combat those tendencies?
Share your experiences by commenting below!
***Photo courtesy of http://www.flickr.com/photos/alexk100/350644178/sizes/
How A “Fixer-Upper” House Can Turn Into A Nightmare
The following is a post by MPFJ staff writer, Kevin Mercadante, who is a professional personal finance blogger, and the owner of his own personal finance blog, OutOfYourRut.com. He has backgrounds in both accounting and the mortgage industry.
One of the very best ways to get a r eal deal on a new home is by buying a “fixer upper”. This provides the opportunity to buy a house that’s in less-than-perfect condition, but also at well below the going market rate for similar properties.
But at the same time, the fixer-upper house can turn into a nightmare. Here are some of them, as well as suggestions on how to avoid them.
The biggest problems can be the ones you don’t see
An ideal situation is to buy a house that is only in need of cosmetic repair. But, cosmetic repairs can hide other problems. There can be significant structural problems behind the cosmetic ones that you won’t discover until you’re in the property and making the repairs.
This happens because fixer-upper’s typically come to the market following a period of neglect. This is easy to see when you consider the typical situations that bring a fixer-upper to the market:
- A foreclosure
- A distressed sale
- An estate sale
In each of the above situations, it is highly likely that the sale of the property was preceded by a prolonged period – perhaps several years – where the previous owner lacked either the physical capability or the financial wherewithal to properly maintain or repair it. As a result, small problems became big problems, and big problems are often the reason why the property is being sold.
Whatever the purpose that is driving the sale, the seller typically lacks the ability or willingness to make the needed repairs, even as a requirement of sale. If you’re buying a fixer upper, the burden of making necessary repairs will be squarely on your shoulders.
It can be difficult to get mortgage financing
As a result of all the above, it is often difficult to get mortgage financing on a fixer-upper property. In order to grant a mortgage on any property, lenders require that the property has no significant issues in regard to safety or livability. Unfortunately, the fixer-uppers often have problems on both fronts.
So much of your ability to get the mortgage on such property will depend upon a specific condition of the house. If the problems are primarily cosmetic, you will generally be able to get financing without issue. But if there’s anything more significant, financing will be anywhere from difficult to impossible to obtain.
Borrowing money to finance repairs is close to impossible
One of the biggest problems in buying a fixer-upper is that you’ll need a significant amount of cash even after you close on the house. This will be especially true if you are unable to perform many or most of the necessary repairs yourself. Borrowing money through a home equity line of credit or a second mortgage on a property that is essentially damaged goods will be more difficult than getting the purchase money first mortgage.
If you’re buying a fixer-upper, you should obtain a finely detailed home inspection report – at a cost of several hundred dollars – before closing on the property. The home inspection will tell you specifically what is wrong with the property, but it can also give you a list of what it will cost to remedy them. Pay close attention to these costs – whatever you cannot fix on your own, you’ll have to pay for – out of your own resources.
Even though a fixer-upper may ultimately be a better investment value, it generally will require more money up front than buying a house in better condition.
The house may not be immediately livable, rentable or salable
Once again, the specific condition of the property is most important. It is possible that the house may not even be livable, if you are planning on occupying it. But if you’re planning to buy it as a rental, or to quickly flip it at a profit, your plans will go up in smoke if the house is neither rentable nor sellable. How quickly after the sale you’ll be able to get the house into an acceptable condition will be part of your success or failure in the venture.
DIY repairs could turn into a full-time job
If you do plan to do most of the work on the house yourself, you need to give yourself a realistic estimate as to how long this will take. Fixing the property could turn into the equivalent of full-time job, and if you have a demanding occupation to begin with, you may not have the time that you need to do the work that needs to be done.
And on the topic of time, whatever amount you estimate you will need to fully repair the property, double it! Deferred maintenance usually means that the depth of repair work will be greater than you initially estimate. For example, when going to replace rotted drywall, you may find the studs behind are also rotted. Now you’re no longer repairing a wall, but tearing it down and replacing it. The situation is not at all uncommon with fixer-upper’s.
The house could become a money pit
This is the nightmare scenario that could develop as a result of buying fixer-upper. The property can turn out to be more deteriorated than your early expectations, and require both more time and money than you budgeted for the project.
Worse, you may discover issues with the property that were either undiscovered or unknowable at the time of the home inspection. For example, recently installed wood paneling in the basement could hide the fact that the basement is subject to flooding. And you may not learn until you began tearing down walls that the house has structural deficiencies that will cost many thousands of dollars to fix.
If you do plan to buy a fixer-upper, here are a few things that you’ll need to make the project a success:
- An extremely accurate idea of what the real value of the property is – a house is not a bargain just because it is a fixer-upper and you should be able get it for well below the prevailing market.
- A very detailed home inspection, from a trusted inspector.
- Any supplemental inspections that the home inspector recommends (don’t cut corners here!)
- A pile of cash, or access to a pile of cash, to cover at least twice the expected repair costs.
- The ability to perform the repair work yourself.
- The time to do the repair work yourself.
- Realistic expectations as to the amount of money that it will cost, the time will take, and how long it will be before you can recover your investment.
Armed with each of the above, a fixer-upper can be an excellent investment. But, if you’re missing even one or two, take your time and get them before proceeding.
How about you all? Have you ever purchased a fixer-upper house? How did it work for you? What would you recommend to someone who is planning on buying one?
Share your experiences by commenting below!
***Photo courtesy of http://www.flickr.com/photos/29766902@N00/387371265/
Is Emergency Roadside Assistance Worth The Cost?
 The following post is by MPFJ staff writer Travis. Travis is a customer blogger for Care One Debt Relief Services, and also appears weekly at Enemy of Debt. Travis candidly shares his personal journey to pay off $109,000 of credit card debt and the tips he’s learned along the way. As a father and husband he provides a unique perspective on balancing debt, finances, and family.
Both hands held a suitcase, and additional bags were hanging off each arm as I walked through the parking lot. We had stayed overnight in a hotel out-of-town and I was packing up the van to head home. It was a struggle to click the button on the key to open the back-end, but after several attempts I finally heard the familiar beep that meant the door would be swinging upward momentarily.
With quick flick of my wrist I flung the van key which landed inside the van and then bounced a few inches forward. I strategically placed the bags inside the van, and slammed the hatch door closed. As soon as the door latched I knew I had made a mistake. Checking all the doors I confirmed my fear, I had locked the keys in the van.
Insert several moments of very colorful language.
I then remembered that during a recent review of our auto insurance, I was reminded that we had emergency roadside assistance that covered just this kind of incident. It would be slight inconvenience, but at least my mistake wouldn’t cost me out anything out-of-pocket.
I dialed up the number on the back of my insurance card and explained what had happened. They asked me for some information, and then using the GPS capability on my phone, they were able to pinpoint my location. They stated that they would contact someone in the area to unlock my vehicle, and they would call me directly when they were on their way. Less than 10 minutes later, a tow truck pulled into the hotel parking lot and unlocked my doors. I thanked the man as he jumped back into his truck and pulled away without even needing a signature from me.
Being the curious guy that I am, I wanted to find out what kind of value I was getting out of my emergency roadside assistance insurance. I later called up the towing company sent to help me and found that they would have charged me $45 had it not been covered by my insurance. Since I pay $9.40 per year for emergency roadside assistance, I just recouped about 5 years of my premium payments. But, even more valuable than that is the peace of mind and convenience my insurance provides.
1.) In an unfamiliar area, I don’t have to worry about finding a service that is affordable or even open at the time need it.
2.) I do not have to pay for the expense out-of-pocket. It turns an unexpected expense, into an expected monthly expense.
For a guy that has a habit of locking the keys in his car, these are very important points.
Additionally, my roadside assistance insurance covers:
1.) Towing of a disabled vehicle
2.) Roadside assistance for running out of gas
Every couple of months my wife and I scrub our monthly expenses looking for things to cut to save us money. Emergency roadside assistance has been discussed more than once, but happily it has always made the cut. It’s not a matter of if we’ll need it, it’s a matter of when.
How about you readers, do you have roadside assistance insurance? How often have you used it?
Share your experiences by commenting below!
***Photo courtesy of anankkml / FreeDigitalPhotos.net
8 Reasons To Always Carry Cash
 The following is a post by MPFJ staff writer, Kevin Mercadante, who is a professional personal finance blogger, and the owner of his own personal finance blog, OutOfYourRut.com. He has backgrounds in both accounting and the mortgage industry.
There’s an open question on the debate between credit cards and debit cards. But, let’s throw a monkey wrench into the conversation, and add cash to the mix.
There are at least eight reasons to always carry cash, no matter how convenient plastic may be, or what benefits it may offer.
1. In case your credit or debit card is denied
There are a number of reasons why a credit or debit card can be denied. Though the most likely reason is insufficient cash on a debit card, or a maxed-out line on a credit card, those are hardly the only reasons. Here are some others:
- A merchant’s card reader may be malfunctioning.
- There could be a technical problem with the issuing bank.
- There could be a problem with the merchant’s bank.
- Your card may be damaged and unreadable – a deactivated magnetized strip is hardly uncommon.
- There could be a mysterious computer glitch anywhere in the process.
- A general power outage could shut down everything.
Having some cash in your wallet, or at home, could come in handy in any of these situations.
2. Giving to a homeless person or charity collection
How many times have you come across a homeless person or someone collecting money for charity, but found yourself unable to give because you have no cash in your wallet? That’s the kind of thing happens when we become completely reliant upon plastic to pay for everything. Opportunities to give will be blown for a lack of a small amount of cash.
3. Spitting a bill at a restaurant
If you have ever been out to dinner with family or friends, and one of them paid the entire meal on plastic, splitting the bill after the fact can be very difficult unless you have cash. Sure, you can get around this easily if each party puts up a credit or debit card at the time of payment. But sometimes in the confusion of the moment, one person puts out their card in an attempt to keep things simple. If you have no cash to pay your portion, that can lead to an uncomfortable situation of leaving the restaurant owing someone money.
4. The gas station dilemma
Many gas retailers have a minimum balance requirement in order for you to pay at the pump with a debit card. It is very typical for example for a gas station to require a minimum balance of $100 in your account in order for you to use the pump. This is likely because the computer does not know how much the sale will be when you begin the transaction – it has to make the worst-case assumption, and $100 will generally cover the largest sale possible. If you only have $95 in your account, you will be unable to pay at the pump.
You can get around this is simply by using your credit card – but who wants to spend the next 10 years paying for gas in a tank that will be empty in a week? You can also go to the attendant and swipe your card for a flat amount, but that’s no more convenient than paying with cash.
5. Tolls and vending machines
Toll takers and vending machines generally don’t take credit cards. If you live in an area with toll roads, or work in a place where vending machines might be the only source of nourishment between meals, having some cash in your wallet will be an oasis in the desert.
6. There are still few places that only take cash
Even in an increasingly cashless society, there are still a few places out there were you can’t pay with plastic. Some examples include street vendors and fruit and vegetable stands. This is also quite typical at fairs and street festivals. While you may find some merchants and vendors will accept plastic, there are still many who work on a cash only basis. Still another place is garage sales – they don’t take plastic, and if they’re smart, they won’t take checks either.
7. If you have kids
If you have kids, you must have cash – period. Even if your child already has a credit or debit card, there are always situations were they need cash. It might be a minor purchase at school, a school related collection effort, or a school fair. Credit and debit cards won’t work in these situations, and you can’t be writing checks for every little thing that happens.
In addition, if the kids want go out with their friends – to go to the movies, bowling, or even just to the mall – you probably won’t hand them your credit card, and checks won’t do them any good. You’ll have to have some cash on hand to fork over, and usually on very short notice.
8. Minimizing identity theft
I’ve saved this for last because it may be the most important.
Every time you make a purchase using a credit or debit card, a paper trail is created. That is an open opportunity for identity theft, particularly since much of it is perpetrated by employees who have access to the trail. You can minimize the chance of identity theft by at least making small purchases in cash, rather than by plastic. Identity thieves hate cash!
How much cash should you carry?
The answer to this question will be different for everyone. Much depends upon what your situation is – for example, how frequently you encounter tolls, how many kids you have, and how likely you are to frequent vendors who only accept cash.
For most people who fall somewhere in the middle, carrying $50-$100 in cash in your wallet will get the job done. Alternatively – to minimize the damage from the theft or loss of your wallet – usually $20-$30 in your wallet, while keeping $100 or so at home.
And whatever you keep either in your wallet or at home, should be held in small bills. A $100 bill will do you little good at a vending machine, or if one of your kids wants $20 to go to movies.
How about you all? Do you carry cash, or do you prefer to go completely cashless? If you do carry cash, how much do you think is enough?
Share your experiences by commenting below!
***Photo courtesy of http://www.flickr.com/photos/jmrosenfeld/2903513401/sizes/n/in/
GainsMaster Investing and Market Timing Approach – Does It Work Or Is It Futile Like All The Others?
If you’ve been reading MPFJ for a while, you’ve probably heard me mention before that I am not a big advocate of people investing large amounts of their own money in active management/market timing, either through the buying and selling of individual stocks yourself, following the advice of a newsletter, with the help of a “professional” investment advisor, or through an actively managed mutual fund.
Having said this, I do find it fascinating to learn about and test out techniques people have developed which claim to be able to “beat the market.” While these methods often seem sound and look good in historical analyses, in real-life practice, these methods fail. For example, I did a 6 month test run of Phil Town’s Rule # 1 investing system, which showed that its usage did not deliver a market beating return due to the trading commissions involved).
Recently, I was reading yet individual stock market investing book called, Invest to Win. This book describes a strategy to investing called the GainsMaster Approach (of course you have to trademark a fancy name when you come up with a strategy for investing so it sells better, haha). Reading through the book, the logic seems sound. However, as we often see with efficient markets, logic does not guarantee that you will be able to outperform the overall stock market.
Anyhow, since the logic seemed sound and the technique very interesting to me, I figured I would give the GainsMaster Approach a detailed run-through to see if it has merit!
The first step in the GainsMaster Approach to individual stock investing is to determine if the overall market is in a GO (bull) state or STOP (bear) state, so essentially timing is the market is going up or down in the near future. This post will be dedicated to discussing the signs associated with this market timing portion of the GainsMaster Approach.
Let’s get started!
Step 1 – Evaluate Whether the Current Price of the S&P 500 Index Has Crossed ABOVE or Crossed BELOW the 12-Month Moving Average
As discussed in the title, the first step in the GainsMaster market timing method is to pull up the S&P500’s 12-month (or 252 trading day) Simple Moving Average on a chart and compare the current S&P500 price.
- If the current S&P500 price crosses ABOVE the 12 month moving average, this is a bullish/GO sign.
- If the current S&P500 price crosses BELOW the 12 month moving average, this is a bearish/STOP sign.
The current chart for the S&P500 is shown below. I obtained this from Sogotrade.com, but this data can be obtained for free from almost any financial website like Google Finance, Yahoo Finance, MSN Money, etc. The red line is the 252 day / 12 month Simple Moving Average. As you can see, the S&P500 index crossed ABOVE the moving average (red) line, meaning that the market is probably in a GO mode.

Step 2 – Determine if the S&P 500 Index Average True Range (ATR) Has Been Increasing or Decreasing Over The Past Two Months to Gauge Current Market Volatility
Next, the GainsMaster Approach recommends examining the S&P500 Index’s Average True Range to assess the level of nervousness/volatility in the market. In times of upward market trends, investors are generally less nervous. The opposite is true before a big downturn in the market.
Personally, I hadn’t heard of the ATR before reading this book, but I learned that the True Range is the difference between highest and lowest prices traded during a single day. The Average True Range is the average of the daily True Range value over a certain time period, usually 14 days.
Below are the signs we’re looking for:
- A GO (bull) sign is indicated by the 14-Day ATR showing a downward trend (decreasing nervousness/decreasing volatility) over the past 2 months.
- A STOP (bear) sign is indicated by the 14-Day ATR showing an upward trend (increasing nervousness/increasing volatility) over the past 2 months.
ATR data is a little trickier to find than the other indicators described in this post. Unfortunately, I did not see that the usual finance sites like Google Finance and Yahoo Finance had ATR data. The authors of the GainsMaster Approach recommend that you look to your online brokerage for ATR data. For me, I found this data in my Sogotrade.com online account. In searching around the Internet, I found that you can also access this data for free (already compiled in chart format for the S&P500) by clicking here or clicking here. Or, if you’re a math nerd like me, you can click here to learn how to calculate it for yourself from historical price data.
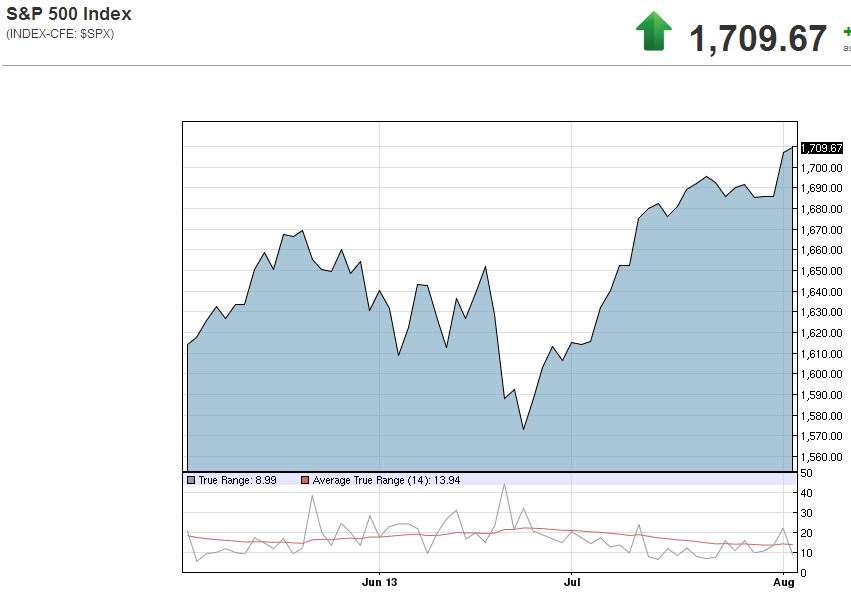
The ATR chart for the current S&P500 index is shown below. The red line in the small bottom graph is the 14 day ATR. As you can see, during the past two months, the ATR has decreased slightly. This is a GO sign!
Step 3 – Gauge Safety-Seeking Behavior By Assessing Whether the S&P500 Index Has Over- or Under-Performed the Dow Jones Utility Average (DJU) Over The Past 2 Months
Prior to a change in market mood, the authors explain that there is almost an accompanying change in the preference of investors’ safety-seeking behavior.
Since utility stocks are stable and pay good dividends, they are often used by investors who feel the markets are dangerous at the current time and want safety. On the other hand, when investors feel the market is strong, they will be investing in regular stocks.
Thus, the GainsMaster Approach recommends keeping an eye on the relative performance of the S&P500 Index (proxy for regular stocks) vs. the Dow Jones Utility Index / Average (proxy for utility stocks). Specifically, we are looking for the following signs.
- GO (bull) Sign = When the S&P 500 index is outperforming the Dow Jones Utilities Index over the past two months
- STOP (bear) Sign = The Dow Jones Utilities index is outperforming the S&P 500 Index over the past two months
You can quickly generate a graph of this 2 month performance comparison in Google Finance. The current comparison chart is shown below. As you can see in the graph, the DJU has outperformed the S&P500 over the past 2 months by a narrow margin, so this is a STOP sign (although a weak one).

Step 4 – Put All of The Indicators Together to Time the Market – Assess Weekly or Monthly
Having gone through all of the mechanics of how this potential market-timing technique works, let’s now just briefly review how it should be executed, as recommended by the developers of the GainsMaster Approach.
- Periodically (I’m going to monitor weekly), watch for a crossing of the 12-month moving average of the S&P500 Index, as explained in Step 1.
- If there is not currently a crossing, just assume that the current market trend (GO/bull currently as of 3-August-2013) will continue.
- If there is a crossing of the 12 month moving average, proceed as described below:
- If there is a crossing of the 12-month moving average, evaluate the Average True Range (Step 2 above) and Dow Jones Utility Average (Step 3) trends described previously.
- Remember that BOTH Average True Range and Dow Jones Utility Average Steps have to show a GO or STOP sign that MATCHES the 12-month moving average crossing direction to indicate a change in the market mood.
- If the 12-month moving average crosses with one signal, but is not confirmed by BOTH of the same signals from the ATR and DJU, then expect the current market mood to continue (but you want to keep monitoring the signals weekly to see if a matching GO or STOP signal pops up).
So, Does This Market Timing Strategy Actually Work? – A Look at Past Performance
In the book that details this strategy, the authors claim that this technique would have correctly timed every major market switch since 1990. They even show graphs/data backing up their claim. However, most of the time with these market timing techniques, it is too good to be true. It’s fairly easy to develop a strategy and make it work retrospectively when the data is under your control, but the real test is how it would play out going through it as a normal individual investor.
Anyhow, I wanted to just examine if this claim about being able to correctly predict the market is true.
Unfortunately, when it comes to pulling up the 3 indicators mentioned above, although it is fairly easy to pull them up in graphical format for recent data, it is a little more difficult to find it for historical backtests. Because of this, I had to take the more manual approach and assemble the 252 day simple moving average and 14-day Average True Range myself from S&P500 historical pricing data (obtained from Yahoo Finance) dating back to 1950.
- After calculating these values, I then set Conditional Formatting in Excel to signal me when the current S&P500 price line crossed the 12 month SMA (Step 1 above).
- Once a crossing occurred, I then weekly monitored the ATR (Step 2 above) and DJU (Step 3 above) change trends to determine if the Gainsmaster Approach predicts that I should be in the market (buy/market increasing) or out of the market (sell/market decreasing).
Next, the question became which historical period to analyze. Since the GainsMaster book did not analyze the 1980’s, I decided to focus my analysis on that 10-year period.
The chart below displays the results of when the GainsMaster Approach dictates an investor should be “in” (green highlighted areas) or “out” (red highlighted areas) of the market.
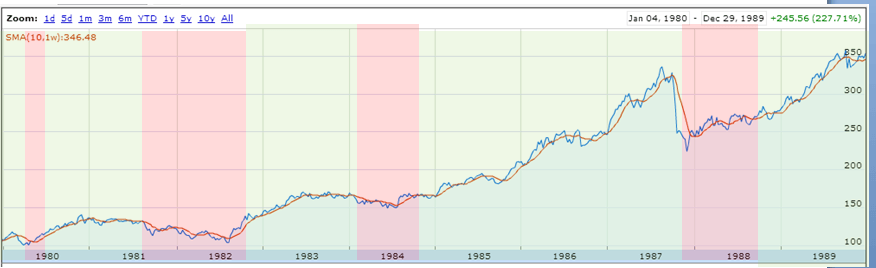
Using the GainsMaster market timing method, you would have been invested in the market during 5 time periods during the 1980’s. While the method seems to be directionally correct in predicting ENORMOUS swings in the market, it doesn’t respond quickly enough all of the time. Additionally, when you’re actually going through this in real-time, it’s impossible to know what is going to be an ENORMOUS swing and what is going to be more subtle.
Let’s take a look at a few examples.
- I will give this method credit that it would have saved investors during the large 1987 market downturn. It dictated getting out of the market on 10/16/1987, and then back in again on 9/26/1988. During this time, the market decreased 5%.
- However, this was really the only time that it was beneficial to use this market timing method vs. passive investing during the 1980’s.
- The GainsMaster approach dictated being out of the market in 1980, 1981-1982, and then again in 1984. During each of these respective periods, the market increased 10%, 7%, and 4% respectively.
- This means that the GainsMaster approach did not work most of the time. It saved you 5% during 1987, but costed you over 20% gains during the rest of the decade.
Overall, if you had invested $10,000 initial investing in an S&P500 index fund on Jan 1st, 1980 and simply held it for ten years, you would have experienced a 206% increase in your money. Conversely, if you had used the GainsMaster approach to market timing, you would have only had an increase on your money of 171%.
If you’re interested in viewing all of the details of my analysis, you can download copy by clicking here.
So, the bottom line here is that GainsMaster market timing Approach, like every other market timing/individual stock picking strategy I’ve seen so far (even though they make logical sense), fails to outperform the market and passive investing with index funds. So, please avoid these strategies and make yourself some real money!
How about you all? Have you ever found a market timing or individual stock investing approach that you think will work, but didn’t end up panning out when you started doing it or got in to analyzing the real data?
Share your experiences by commenting below!
Carnival of Personal Finance #425 – Price of Tour de France Bikes – August 5th, 2013 Edition
 Welcome to this week’s Carnival of Personal Finance, a weekly listing of the top personal finance articles around the blogosphere in the following categories – taxes, money management, investing, career, debt, frugality, credit, economy, finance, real estate, saving, and budgeting.
With the Tour de France and Tour de Personal Finance finishing only about a week or so ago, I thought a fun theme for today’s carnival would be to review some of the market prices for the “top-of-the-line” bikes that the professional cyclists in the Tour de France get to ride for free as part of their sponsorship deals. The prices for the 4 bikes shown below can be seen in the red caption below each picture. Enjoy!
I hope you enjoy the posts and that you can stop by My Personal Finance Journey on my non-carnival days as well!
Listed below are this week’s top 3 editor’s picks. Congrats to the three winners! Some truly great articles here!
1. PK from Don’t Quit Your Day Job… presents Do You Make More Money Than You Did 6 Years Ago?, and says, “Other than a brief spike as people pulled income forward to avoid tax increases in December, Americans have been below their peak disposable income in real terms for some time now. Although we saw the other day that folks have more wealth than 2007, how is America doing in the income department?”
2. Pauline from Reach Financial Independence presents Early retirement in the US vs abroad, and says, “Early retirement can be easily achieved in a country with low costs of living. Is it worth it?
3. Mr PoP from Planting Our Pennies presents Just Out Of School, Deep In Debt, Job Sucks. What To Do?, and says, “Mr PoP provides real, actionable steps that he took to go from a low-paying job fixing computers to a job in B2B sales where he made over $100K last year. And all of this, with a “worthless” philosophy degree. ”

Alberto Contador’s Specialized S-Works Tarmac SL4 – $8,000
And, listed below are the rest of this week’s great article submissions.
Glen Craig from Free From Broke presents Diplomatically Say No to Friends and Family That Want to Borrow Money – 6 Tips, and says, “They want to borrow money from you. It’s tough when friends or family come asking. How do you say no without risking your relationship. See how.”
Matthew from Investing Five Daily presents DRIP Update, and says, “An update on the power of DRIP investing.”
Kristen from My Dollar Plan presents How to Save Money on Textbooks, and says, “If you know someone headed back to school in a few weeks, this is a must-read!”
Emily from Evolving Personal Finance presents Just Make a Decision, and says, “It’s often better to make a decision and carry it out than to delay inordinately, even if it’s not the 100% perfect solution.”
Michael Kitces from Nerd’s Eye View presents IRS Opens Door In PLR 201330016 For 1035 Exchange By Beneficiary Of Fixed And Variable Inherited Annuities, and says, “Using annuities for retirement income has become increasingly popular in recent years, which one unfortunate caveat: whatever annuity was used during life was the type of annuity the beneficiaries were stuck with in the future. But no longer – with a recent ruling, the IRS has opened the door for annuity beneficiaries to change to a new annuity that better suits their own needs and circumstances!”
Nicole from Nicole and Maggie: Grumpy Rumblings presents Ask the grumpies: Demographic stats for the self-employed, and says, “Ever wonder what it’s really like for the average self-employed person? Nicole and Maggie break out the stats on self-employment demographics.”
Jason Hull from Hull Financial Planning presents Use Anti-Motivation to Pay Down Debt, and says, “Sometimes the carrot works to help us pay down debt, but sometimes we need to bring out the stick. This article explains how to use the stick to motivate yourself to get out of debt.”
Evan from How Much Money At One Time Would Change Your Life? presents How Much Money At One Time Would Change Your Life?, and says, “I need a bigger and bigger number to make a difference in my life. My guess it is only natural.”

Nairo Quintana’s Pinarello Dogma 65.1 Think 2 – $12,000
Pauline from Make Money Your Way presents Make More Money During The Holidays, and says, “Be it summer holidays, long weekends or Christmas, there are plenty of opportunities to make extra money if you are willing to work when the majority rests.”
Miss T. from Prairie Eco Thrifter presents On Environmentalism Becoming Consumerism, and says, “Environmentalism and sustainable living isn’t about buying a product to make yourself more green or friendly to nature. All the consuming in the world isn’t going to help one bit. It’s about changing major parts of your lifestyle for the good of the planet and its inhabitants.”
Jon from Novel Investor presents Stock Basics: The P/E Ratio, and says, “Investors like ratios and the P/E ratio or price to earnings ratio is the most popular. The P/E ratio tells us how much investors will pay for earnings.”
Daniel from What Was The Last Thing You Bought In A Store? presents What Was The Last Thing You Bought In A Store?, and says, “I have gotten so used to purchasing everything online, it is hard for me to remember what the last is that I bought in a store. Can you remember?”
Eric from Narrow Bridge Finance presents Cash Back or Frequent Flyer Miles Credit Card?, and says, “I’ve had a few conversation with friends lately about cash back credit cards and miles credit cards. I recorded my first ever video blog post to explain which one I think is better.”
Ray from Squirrelers presents Take Cash In Hand Instead of a Promise of Future Payment, and says, “Promises are often kept, but not always. This is why it’s important to consider the advantage of choosing upfront cash instead, as discussed in this post.”
Bryce from Save and Conquer presents How Much Cash Do You Keep on Hand?, and says, “I do not keep a stash of cash at home. We can always get cash at an ATM or grocery store that accepts ATM purchases. it appears that quite a few people, more than I would have expected, do keep something like $1000-$2000 in cash at home for emergencies. If there is an emergency and ATMs don’t work, we will make do with what is in our wallets and in our pantry.”

Mark Cavendish’s Tour de France Specialized Venge – $18,000
Daisy from When Life Gives You Lemons, Add Vodka. presents Get 2.5% Interest on Your Savings Account, and says, “It’s a good option to consider ING in order to get 2.5% interest on your savings account.”
Oscar from Money is the Root presents Retirement Saving Tips for Married Couples, and says, “Enjoy your golden years together without worrying about money.”
DPF from Digital Personal Finance presents 2 Different Reasons People Use Credit Cards: Which Applies to You?, and says, “Many people use cards to delay payment and buy things they can’t afford. What about using them simply for convenience as the primary purpose?”

Thomas Voeckler’s Colnago C59 Team Edition – $12,500
Lance from Money Life and More presents How Getting Married Changed Our Finances, and says, “Guess what happened while you guys weren’t paying attention? We got married! So now that the secret is out, I figured I’d share how getting married has changed our finances.”
Roger Wohlner from The Chicago Financial Planner presents Is My Pension Safe?, and says, “The city of Detroit recently filed the largest municipal bankruptcy in history. One of the potential casualties of this situation will likely be retired city workers receiving pensions. While pension payments are promises made by the employer, should the bankruptcy go through the city will be free to cut pension benefits as part of the restructuring of the city’s finances. In light of this situation, how safe is your pension?”
Well, that concludes this week’s edition of the Carnival of Personal Finance! To all of this week’s participants – it was an honor to be able to read and get involved with such high quality articles! Please remember to link back to this post if your article was included here and to promote via social media when possible.
Next week’s carnival (#426) is scheduled to take place on August 12th, 2013. Be sure to submit your articles for next week’s edition, using the following handy submission form.
Also, if you’re interested in hosting a future edition of the Carnival of Personal Finance, you can apply using this form.
5 Tips For Turning Your Home Into A Vacation Rental
 The following post is by MPFJ staff writer, Shondell of Call Me What You Want, Even Cheap. She blogs about her recent car loan and mortgage pay off and a whole bunch more. Check out her blog right here.
If you live in an area frequented by tourists and vacationers, then it may not be a bad idea to turn your house into a vacation home.
Vacation rental is a huge industry and offers you the opportunity to supplement your income during the holiday seasons. In fact, many people with a home (or homes) in tourist areas make a major portion of their annual income from renting out their homes. This allows you to attend to your other businesses while your house quietly makes money for you. However, not every house can be profitably turned into a vacation rental; therefore, you have to do some research and may have to carry out a few modifications before turning your house into one.
Here are 5 tips for turning your home into a vacation rental:
1. Determine if your home is suitable:
Your home should be in or near a tourist area for it to be suitable for a vacation rental. It should provide easy access to all the things vacationers come for, such as the beach, landmarks, theme parks and great outdoors. It should also have modern amenities such as a telephone, internet, a fully equipped kitchen, air conditioner (for hot weather) and heating system (for cold weather). A house that is not in the right place and doesn’t have any comfort features will find very few takers, if at all.
2. Prepare your house:
Once you have determined that your home is suitable for a vacation rental, you should prepare it for the same. This requires some money, but you can quickly recover your investment once your house is rented. First, clean the house thoroughly. Hire a cleaning service if you are not up to the task. Repair or replace the furniture, carpets, doors, windows and electrical fittings if they are broken or worn out. Paint the walls and ceilings with attractive colors if necessary. Your home should be neat, clean and attractive before you can show it to any would-be tenants.
3. Set a suitable price:
After you have prepared your home for rent, research the market to find the right price for your home. Find out the amount charged by similar-sized homes in your area and determine whether you can set the same or a slightly different price. When setting the price, you should consider your home’s location, size, accessibility, amenities and the kind of people you want to have as guests. If you are targeting affluent vacationers, then you can set the price a notch or two higher than the average price, but that should be backed by a great location and plenty of amenities.
4. Advertise:
If your home is in a busy location, then vacationers will come looking for you. Otherwise, advertising is the only way to find tenants quickly. You can advertise either in the local papers or on the internet or both. Word-of-mouth is also a good idea if you have a small budget. Whatever you decide to do, you need to create an attractive ad with beautiful photos of both the interior and exterior of your house. Also, do not forget to mention the amenities and your home’s proximity to parks, malls, diners and other places of interest.
5. Screen the tenants carefully:
Although money is important, you don’t want to invite trouble by renting your home to the wrong people. The worst thing you can do is harbor criminals and terrorists, which can easily land in trouble with the law. So do not hurry to rent your house out to the first people who come knocking on your door. Screen every would-be tenant carefully. Ask them where they are from, what they do for a living, why they wish to rent your place, who they will be living with and whether they will be having parties. If you are doubtful, you may also ask for a small security deposit, which is quite the norm.
Ideally, you should be able to leave everything to the tenants’ care after they move in. But that is often not the case as problems relating to things like water, electricity, telephone and security often arise. The first thing you should do after handing over the keys to your home is give the tenants your telephone or cell phone number so they can contact you if any emergency occurs. You should also inform your neighbors and relatives so they will know what is happening. If your tenants have any complaints or concerns, you should attend to them immediately. Once the word spreads that you are a great landlord, you will get good tenants every holiday season.
How about you all? Would you consider renting out your home to vacationers?
Share your experiences by commenting below!
***Photo courtesy o fhttp://farm2.staticflickr.com/1230/4724901591_0400dc3e99_o.jpg
Issues With 401k Plans And How To Compensate For Them
 The following is a post by MPFJ staff writer, Toi Williams, who is a personal finance blogger over at Fine Tuned Finances. She has backgrounds in personal finance, sales, and real estate.
Over the past decades, the defined-benefit pension plan has been replaced with the 401k plan as the dominant retirement plan saving vehicle for most workers in the United States.
While 401k plans give the workers more control over their retirement income by allowing workers to save more for retirement and decide which investments to include in their plans, there are a number of issues that have arisen with these plans over the years that workers should be aware of. Some of these issues require additional actions to compensate for the issue while other issues should be avoided completely if possible.
Here are the issues that you should be aware of regarding 401k plans and how to compensate for them:
Long Time Horizons For Investments
One of the biggest issues found with 401k plans is that there are extremely long time horizons for your investments, making it very difficult to choose the best investments for your plan. Developing a long-term strategic asset allocation based on a time horizon that will typically exceed a decade in length is complicated enough, but adding in the fact that the portfolio managers and the funds available in the plan are likely to change during that time makes smart investing even harder. You will have to find the balance between the shorter-term tenure of the portfolio managers and the longer-term investment holding period.
Many investors use index funds to make that balance. However, if there are not many index funds offered in your 401(k) plan, you have a couple of other options that can be used to address this problem. One option is to develop a tactical asset allocation contingency plan that can be put into place in the event one of your portfolio managers relinquish responsibility. Another option is to open a traditional IRA or Roth IRA that has index fund strategies that are not available in your 401k plan and contribute up to the legal limit.
Flaws In The Structure Of The Plans
There are a number of structural flaws in 401k plans that can be devastating to the unwary investor. Many people invest in their 401k accounts using the dollar cost averaging methodology, meaning that they buy a fixed dollar amount of a particular investment on a regular schedule regardless of the share price, which they believe will allow them to prudently build their retirement nest egg over time. This is a good method to use when the market is trending up, but can cause you to lose a significant amount of money when the market is trending down.
Instead of using an automatic investment method like dollar cost averaging, take control of your investing by directing all of your retirement plan contributions into a conservative investment option. Then, you can make a strategic investment allocation of the cash that you have accumulated into a promising fund offered in your 401k plan when the time is right. The investments chosen for your 401k plan are your responsibility, so you should be active in choosing how to allocate your money into different investment choices.
Fees And Administrative Charges
Many employer-sponsored 401k plans are expensive. Because of the number of compliance issues that have to be monitored, it is important for the plans to be administered correctly and that can cost a lot of money. The plan administrator is required to conduct a number of ongoing service and administration functions and must provide plan participants with a variety of education and communication services. To pay for these services, many plan participants are charged participant fees, supplemental asset based charges, and other itemized costs for services.
Developing a tailored retirement plan strategy can help you mitigate some of the costs of your 401k plan. Instead of using your 401k as your primary retirement savings vehicle, only contribute to the plan up to the point where you receive 100% of your employer’s matching contribution. Then, you can open a low-cost IRA with a brokerage firm or through a local bank in your area and contribute up to your legal limit. In nearly all cases, the various investment options available through an IRA will be much less expensive than the options available through an employer-sponsored 401k plan.
Recordkeeping Issues
Recordkeeping for the assets accumulated in your 401k plan is a labor-intensive endeavor, even in today’s technological age. In most cases, the records have been generated for many years and may contain errors and omissions due to the mistakes of the people tasked with compiling these records. Typically, retirement plan providers will provide only what the law requires in your statements, and what is required by law may not necessarily be what you need to make an accurate financial assessment of your investment strategy.
If your retirement plan provider does not provide the information you need in an investor-friendly statement, you may want to take care of your recordkeeping yourself. The simplest way to do this is to build a spreadsheet that you can use to track your information. To create your spreadsheet, you can use the important information from your monthly or quarterly statements, such as your beginning account balance, the amount contributed to your retirement plan account by you and your employer, the amount of any transfers or withdrawals made during the period, the amount of any gains or losses experienced and the ending balance of the account. After inputting the information, you can manually calculate your annualized rate of return. This will help you see whether you are on track in terms of meeting your long-term financial goals.
How about you all? What issues have you run into with your 401k plan? What have you done to fix or compensate for them?
Share your experiences by commenting below!
Picture: http://www.flickr.com/photos/76657755@N04/7067724529/
How Do You Analyze Individual Stocks? – Part 2 – The Periodic Check-In
If you’ve been reading MPFJ for a while, you’ve probably heard me mention before that I am not a big advocate of people investing large amounts of their own money in active management, either through the buying and selling of individual stocks yourself, following the advice of a newsletter, with the help of a “professional” investment advisor, or through an actively managed mutual fund.
Why do I shy away from large investments in individual stocks? Simple. Because the track record of individuals (even professionals) selecting individual stocks does not show proof positive that it is worth the cost involved. In fact, 70% of the stock professionals fail to beat out the market, so why would I think I can do this consistently?
Having said that, I do, however, think that analyzing individual stocks for investing using smaller amounts of play money is a fascinating exercise, and it’s something that I would like to believe in. I just haven’t seen proof that it can be done consistently in an efficient manner, but maybe someone will prove me wrong one day and cause me to switch from my current approach of passive investing using index mutual funds and ETFs.
Anyhow, back in February of this year, I did a post sharing my strategy for how I perform the preliminary analysis of individual stocks for potential buying opportunities, using the specific stock, MGT Capital Investments, Inc. (AMEX/NYSE symbol: MGT), as an example.
Today, I wanted to continue this series/investigation by sharing the method that I use for another very important part of the individual stock investing process, the periodic check-in. Again, I’ll be using the stock, MGT Capital Investments, as an example for consistency.
Basically, what we want to do with the periodic check-in process is to compare where the company is now vs. where it was when the preliminary analysis was performed to determine if it still makes sense for you to be holding the stock.
As a brief recap, in my preliminary analysis of MGT’s stock, my conclusion was that since the company has a good business model, strong leader in their CEO, and the recent key financial number change trends were pointing upwards, MGT would be a speculative “buy” when the 3 technical indicators I use turned positive.
Step 1 – 30,000 Foot Elevation View of the Company and Price Performance
To get a very high level overview/update on how the company is doing, I first turn to Google Finance and look up the ticker symbol.
On Google Finance, I specifically am looking at 3 things – 1) price history since I last analyzed the stock and 2) the current financials. I like to use Google Finance for this purpose because all of these items are displayed on a single page, making it very easy to navigate.
Shown below are these two items for the stock that I’m using as an example, MGT, as well as the appropriate screen shots from Google Finance. I’ve also left in the February 2013 screen shots for comparison as well.
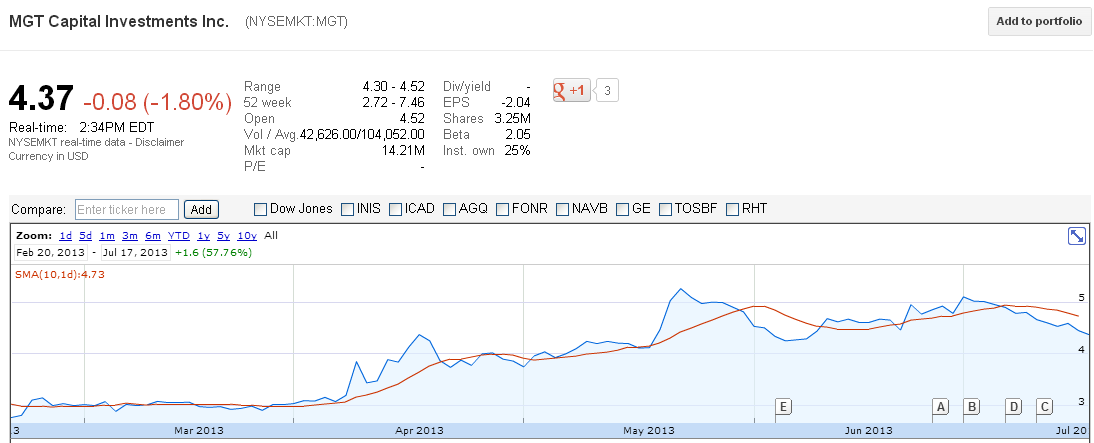
- Since I first assessed this stock on Feb 20th, 2013, MGT has experienced quite a run up in price.
- Between February and now in July 2013, the stock price has increased from $2.85 to $4.37 per share, a growth of close to 60%!
- While this growth was hard to predict exactly, it is not totally surprising, considering the things mentioned in my preliminary analysis about the company having good recent financial change trends.
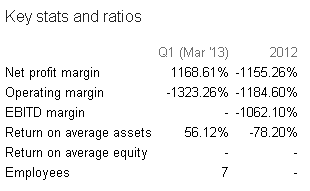
- Regarding the high-level financial figures, the overall change seems to be positive / in the correct direction.
- Although EPS has decreased, pretty much all of the financials seem to have improved in the past 5 months or so – with market cap, trading volume, shares outstanding, margins, ROE, and ROA all increasing.
- In addition, it also appears that they have downsized two employees, since they now have 7 employees, down from 9 previously. This will be something I want to investigate from a qualitative perspective as well.
- It is also worthwhile to note that MGT still has a very small number of shares outstanding (only 3 million). What this means is that the stock is potentially very ill-liquid / volatile.
 |
| MGT Stock Price History |
 |
| MGT Financials |
Step 2 – See If There Have Been Any Changes Regarding How the Stock Fits Within Phil Town’s Rule # 1 Investing Analysis System
As I mentioned previously in my 6 month test run of Phil Town’s Rule # 1 investing system (which showed that its usage did not deliver a market beating return due to the trading commissions involved), I do not believe that Phil’s system is the “magic formula” for beating the market. However, Phil’s approach does involve some very prudent technical and fundamental analysis which I feel can give me a deeper understanding of how the company is functioning as an investment.
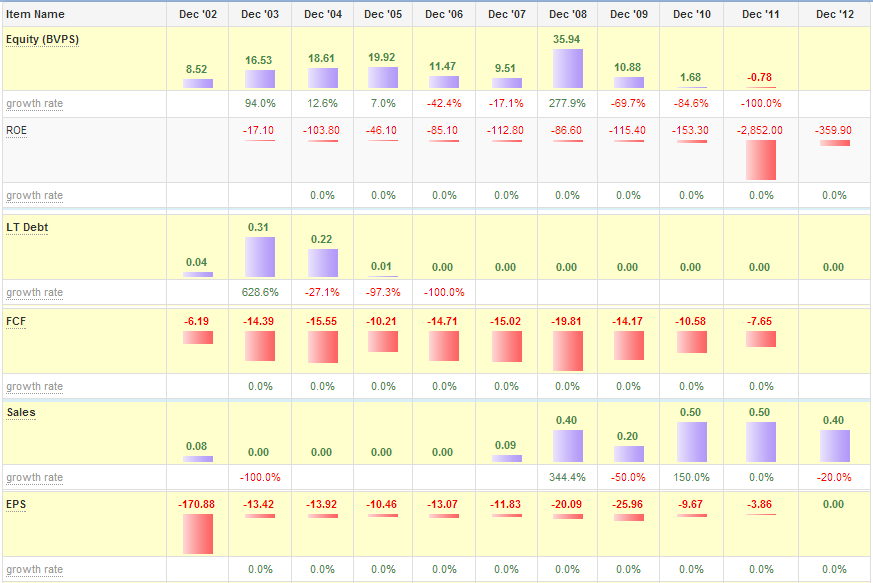
- Phil Town Criteria – Identify if the company has a “moat” – What he explains we are looking for here is >10% annual growth rate over 10 years for the following things: 1) Return on investment capital, 2) sales revenue, 3) EPS growth, 4) Equity per share, and 5) free cash flow growth. We also make sure that the company has enough current free cash flow to be able to pay back it’s long term debt in 3 years or less.
- A great place to get all of this 10 year historical data in one place is Stock2Own.com. If you type in the ticker symbol of the stock you’d like to analyze in the box at the top, it will then automatically calculate all of these five financial ratios for you. These can be accessed by clicking the Annual Statements option on the left sidebar.
- The data for MGT is shown in the attached screenshot below.
- As I mentioned previously for MGT (and as is still the case), the 10-year average financial calculations above do not look very good because of all of the negative values it is carrying, and as such, are definitely NOT in line with Phil Town’s criteria. Return on investment capital (or ROE), EPS growth, and free cash flow growth are all either deeply negative or zero. Furthermore, the company has negative free cash flow,but at the same time, they still have no long term debt.
- At ~31% annual growth over the past 10 years, sales revenue does fit the “moat” criteria.
- At 11.9% annual growth over the past 9 years, Equity per share does fit the “moat” criteria.
- These growth rates are a slight improvement from the way the company looked in February of 2013.
Even though MGT still does not meet the Return on Investment Capital, EPS, and Free Cash Flow moat criteria set forth in the Phil Town method, this is not very surprising because it is a speculative play.
- Phil Town Criteria # 3 – Calculate the appropriate sticker price, or what the stock should be selling at given it’s current EPS and EPS growth rate. We then calculate the Margin of Safety price (MOS) to make sure that we buy the stock at a significant enough (50%) discount to shield ourselves from mistakes and be able to achieve higher returns.
- Fortunately, the tool listed above, Stock2Own.com also has a handy feature that automatically calculates the sticker price (Value Price) and Margin of Safety (MOS) price.
- To view this in Stock2Own, simply click the Value Price option in the left sidebar.
- Unfortunately, for MGT, since their EPS is still negative (as it was back in Feb of this year), a MOS/Value Price cannot be calculated, so we don’t have this gauging point to base our decisions off of.
- In the case of MGT, since their EPS is negative, we also cannot gauge effectively whether or not the stock is now “overvalued” now that the price has increased to around the $4 per share range. In fact, since the EPS is negative, this means that the stock has been OVERVALUED the entire time (even during the preliminary analysis! haha).
- While this is unfortunate, there is not much else we can do but soldier on and make our decision with the other information available to us.
- Phil Town Criteria # 4 – Use technical analysis tools to make sure you are either buying or selling at the right time. Phil recommends using three technical tools to make sure of this – 1) 8-17-9 MACD indicator, 2) 14K, 5D Slow Stochastic Oscillator, and the 3) 10-day moving average. Phil recommends that you only buy when all 3 of the tech. indicators say “buy.”
- To generate these three graphs for a stock analysis, I again use Google Finance. To set it up, you simply click, “Technicals,” at the bottom of any Google Finance stock price history window, and fill out the fields as shown in the below screenshot:
- Once you’ve set up the indicators, view the 3 month history graphs for the stock you’re analyzing. Three months seems to be a good time period in order to clearly see whether the technical indicators are saying “buy” or “sell.”
- For analyzing MGT, the SMA, MACD, and SSTO technicals are all shown on the combined chart below:
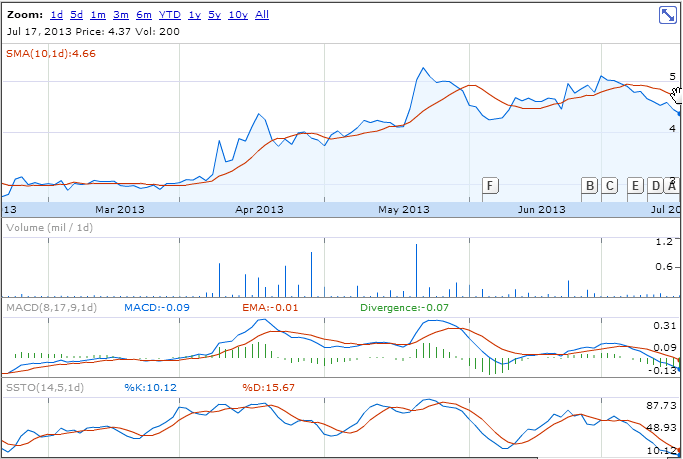
- First, the 10 day simple moving average (red line), compared to the actual stock price (blue line). With the simple moving average, a “buy” signal is indicated by when the stock price line crosses above the moving average.
- In the case of MGT, the stock price is currently below the moving average, indicating that we do not want to buy right now.
- MGT’s 14K, 5D Slow Stochastic Oscillator. With the stochastic, the K line (blue) is the “buy” line, and the D line (red) is the “sell” line. With this technical indicator, a “buy” signal is indicated by when the buy/K line crosses above the sell/D.
- In the case of MGT, the K line is currently below the D line, indicating that we do not want to buy right now.
- MGT’s 8-17-9 MACD indicator is shown below. With this technical indicator, a “buy” signal is indicated by when the MACD line crosses above the EMA line.
- In the case of MGT, the MACD appears to have decreased below the EMA, indicating that we do not want to buy right now.
Step 3 – Qualitative Research On The Company, The Management (CEO especially), Current News, and That No Insider Selling Is Happening
As the title above suggests, the next step I take in the periodic check-in is to analyze how the company I’m following is performing compared to when I last researched about it and check in on how the noteworthy events mentioned in my preliminary analysis unfolded. This is also a good time to research any questions that have popped up from the more quantitative investigations discussed above.
Listed below is how I tackle this step, using the stock, MGT, as an example:
- Management Analysis (done through Google Finance and Reuters.com) – As was the case in my preliminary analysis of MGT, the current CEO is still Robert Ladd. He joined the company in 2010 as a director and became CEO in early 2012. This occurred almost exactly the same time at which the stock price for the company increased from almost $0 to $4 per share. There was also a stock split at this same time. At a high level, this appears that the market took the news of a new CEO as good and that Mr. Ladd was assessed as a good leader. Ladd also has a long history of investment analysis, which is important in his role as head of a holding company where he is making investments as his primary business. I also found another article stating that Mr. Ladd is “responsible for rejuvenating the company. As far as I can tell, Ladd continues to do a stellar job at the head of MGT.
- Insider Trading (done through company website or MSN Money) – In looking at the recent transactions of company insiders, the CEO, Robert Ladd, sold off ~5% of his total shares (20,000 shares sold) during mid June 2013 (around $100k worth). This is not necessarily the best thing to see, since it might indicate that the CEO sees the current stock price as the highest it will get for a while. However, Robert Ladd continues to the largest shareholder (with ~400,000 shares), meaning that the management goals are indeed aligned with shareholder benefit. It is still encouraging to note that the management only have reported income that they pay themselves of $200 per year or so, so it appears that their salary is heavily weighted in stock options/stock performance.
- Additional Clarity About What the Company Does/Its Current Position (find the “news” columns on Reuters, Yahoo/Google Finance, etc after you bring up the chart for a specific stock) –
- In reading a May 2013 investor presentation, I found out that MGT acquired a majority stake in April 2013 in an online fantasy sports wagering platform called, Fan Throwdown. In addition, they purchased Hammercat Studios in May 2013, which will eventually give them exposure to earn money from a mobile platform for skills-based game wagering.
- Both of these purchases are encouraging to see, as it represents good growth opportunity potential for the company.
- It also represents a logical diversification stream of revenue in to the sports and skills-based wagering realms to complement their gambling side of the business.
- I had found out during my preliminary February 2013 analysis that MGT is selling off its medical holdings because it did not fit and wasn’t profitable for them. They have decided only to focus on their gaming patent development for now.
- In searching around online, I found out that the company has completed the sale of its medical imaging patents. They were sold to the Samsung Corporation for $1.5 MM. Of this, the company expects to report a gain on the sale of $750k. This is good progress to see!
- This sale of MGT Medical is likely responsible for the decrease in employees from 9 previously to 7 now.
- Finally, the company is still awaiting the Markman Hearing to see if they will get any money from potential patent infringement against one of their gambling patents they own. However, there has apparently been a court date decided. It will be June 5th, 2014, so quite a long time to wait!
- Overall, it seems that the company is at a point where they are building for long-term success. As such, the recent increase in price doesn’t seem to hinge on some high-risk project being undertaken by the company, which is a good thing.
- In reading a May 2013 investor presentation, I found out that MGT acquired a majority stake in April 2013 in an online fantasy sports wagering platform called, Fan Throwdown. In addition, they purchased Hammercat Studios in May 2013, which will eventually give them exposure to earn money from a mobile platform for skills-based game wagering.
Step 4 – Review and Decision Hold, Buy More, or Sell Your Current Positions
Having now completed all of the steps I do in the periodic check-in, it is time to review what has been seen and decide if I would hold or sell shares I already have or buy more shares.
Using our example of MGT, here are my conclusions:
- MGT’s stock price has increased significantly (60%) since the preliminary analysis was performed 5 months ago in February 2013.
- Unfortunately, since MGT’s EPS is/has been negative, we cannot calculate a margin of safety/sticker price to determine if the stock selling for a good price or not. Technically, since the EPS is negative, it has been and continues to be HIGHLY OVERVALUED.
- Even though several of the important financials for MGT are in fact “in the red,” the change trends over the past 1-3 years continue to point towards that the company is heading in the right direction.
- All three technical indicators dictate that now is NOT a good time to buy MGT shares.
- From a qualitative perspective, the company still has a great CEO, has made some very nice (and logical) investments in recent months to expand their business in to skill-based and sports-wagering, and has made good progress with selling off their medical holdings.
- Because of all these considerations, I would hold my current MGT shares and buy more when the 3 technical indicators mentioned above give the green light.
How about you all? What is your approach to periodically checking in on individual stocks for potential investment? How much of your money do you allocate to individual stocks vs. mutual funds?
Share your experiences by commenting below!
Debt Free Direct Tour de Personal Finance 2013 Post-Race Show – $1,400 Ceremony, Race Recap, and Goals for the 2014 Tour
 On June 25th, I announced the coming arrival of the 3rd annual Tour de Personal Finance with an introductory post laying out several goals I had for the event.
Over one month later, the 2013 Debt Free Direct Tour de Personal Finance has ended, a winner has been crowned, $1,400 in prizes has been dished out, and I can decisively say that the 2013 edition of the event has been a great success! The success could not have been possible without tremendous support from the participants and readers/voters. A big round of applause is in order for all of you! **Cheers fill the streets!**
We greatly appreciate Debt Free Direct for being the title partner of the 2013 event and for all their great support. If you’re interested in learning more about the help and advice Debt Free Direct offers to people in debt or their money-saving tips on how to prevent building up debt, click here.
Awards Ceremony and Charity Selections
In the Tour de France, there are 4 main winners’ jerseys that are fiercely contested. These include the Yellow Jersey (overall winner), Green Jersey (best sprinter), Polka-Dot Jersey (King of the Mountains), and White Jersey (best-placed young cyclist).
As such, along with crowning the overall winner with the Yellow Jersey and the 2nd and 3rd podium placements, the Tour de Personal Finance will recognize 3 additional winners, as described below:
- Yellow Jersey – Winner of overall competition. Article voted “best” by readers. Way to go!
- The Yellow Jersey winner for 2013 is John from Frugal Rules with his article entitled, “Is it Time to Get Out of the Stock Market?” (from the Savings / Investing group of articles). A brief description of the article is shown below:
- “Whenever we see highs or lows in the stock market we see an increasing number of talking heads telling us what we should do with our portfolios. The problem with listening to them is they have no idea of your personal situation. That said, these are great times to analyze your portfolio while remembering the importance of maintaining a long-term view of your investing.”
- As the Yellow Jersey winner, John received $100 cash via Paypal. Thanks so much for all your hard-work, John, throughout the month of July.
- The Yellow Jersey winner for 2013 is John from Frugal Rules with his article entitled, “Is it Time to Get Out of the Stock Market?” (from the Savings / Investing group of articles). A brief description of the article is shown below:
- Yellow Jersey Charity Selection – As the Yellow Jersey winner, John also decides which charity he wants to have receive the $700 charity give back amount.
- John elected for the $700 to be donated to the Trisomy 18 Foundation in memory of his son, Isaac Joseph Schmoll, who they lost to the Trisomy 18 genetic disorder.
- This disease is caused by the presence of an extra 18th chromosome (so 3 instead of the normal 2).
- It is my honor to be able to donate to a charity/cause that is very near and dear to John and his family’s hearts. Great stuff! 🙂
- In addition to this, I donated an extra $200 to the National Multiple Sclerosis Society for this event.
- Podium Placings – The 2nd and 3rd placed articles that are on the podium with John are shown below. Congrats for making it so far in to the competition!
- 2nd Place – Crystal from Budgeting in the Fun Stuff with her article entitled, “My Husband is Now WORKING FROM HOME WITH ME!!!” A short description of his article is shown below:
- “It’s important to work out a plan before leaping into self-employment. It’s even more important when that entrepreneurial spirit hits both of the income earners of the household. But after running the numbers, looking at worst case scenarios, and mulling the idea over…it was time for us to put on our big girl panties and jump in.
 Here’s the post about the excitement and fear when we officially put all of our financial eggs in one basket and happily skipped away into the unknown…”
 - At first, I wasn’t planning on doing any prizes for the 2nd place podium finisher. However, Crystal did such an inspirational job in the event, that I felt something was due to honor that excellent performance.
- As such, as the 2nd place podium finisher, I donated $200 to the charity chosen by Crystal (the Houston SPCA). In addition, she matched this contribution with another $200, so $400 total went to the Houston SPCA to help their mission to save pet lives. Great stuff!
- “It’s important to work out a plan before leaping into self-employment. It’s even more important when that entrepreneurial spirit hits both of the income earners of the household. But after running the numbers, looking at worst case scenarios, and mulling the idea over…it was time for us to put on our big girl panties and jump in.
- 3rd Place – Boomer and Echo with their article entitled, “How My Retirement Plans Got Derailed – Big Time!” A brief description is as follows:
- “I left my secure job at a major bank to open a small retail store with my husband. We struggled along for three years, using up almost all our savings and making the terrible mistake of financing the business with our many credit cards. Eventually we gave up and closed the store. With no money and over $100,000 in credit card debt, we sank to our lowest point of despair.”
- A hearty applause to all our podium finishers!!! 🙂
- 2nd Place – Crystal from Budgeting in the Fun Stuff with her article entitled, “My Husband is Now WORKING FROM HOME WITH ME!!!” A short description of his article is shown below:
- White Jersey – Goes to highest placing, new blog (blog that was started less than one year ago).
- The White Jersey winner for 2013 is Matt Becker from Mom and Dad Money. His article (“My Life Insurance Mistake“) made it to the 4th Round of the competition, which is NO SMALL FEAT. Nice work Matt! I’m sure we’ll see some great things from in the future!
- Green Jersey – Goes to the blog whose article wins a single stage “the fastest.” In other words, the Green Jersey goes to the blog who wins a single stage by the biggest margin against their competitor.
- The Green Jersey winner for 2013 is David from Marotta on Money. His article entitled, “How Much Should I Save Toward Retirement If I’m Starting Late?,” won one of the Stages in which it was competing by 12 votes over his competitor! Quite impressive! Nice work David! The sprinters of the Tour de France (such as Andre Greipel and Mark Cavendish) would be proud of you! Your next goal will have to be to win 6 stages like Cavendish did in the 2011 Tour de France!
- The Green Jersey winner for 2013 is David from Marotta on Money. His article entitled, “How Much Should I Save Toward Retirement If I’m Starting Late?,” won one of the Stages in which it was competing by 12 votes over his competitor! Quite impressive! Nice work David! The sprinters of the Tour de France (such as Andre Greipel and Mark Cavendish) would be proud of you! Your next goal will have to be to win 6 stages like Cavendish did in the 2011 Tour de France!
- Polka-Dot Jersey – Goes to the best placing blog article entered which details information on “climbing” out of the debt “mountain”.
- The Polka-Dot Jersey winner for 2013 is J Money from Budgets Are Sexy with his article entitled, ”Which Is Harder: Paying off Debt or Saving Money?” J’s post made it to the 4th Round of competition. Nice work J Money!
 Here’s the post about the excitement and fear when we officially put all of our financial eggs in one basket and happily skipped away into the unknown…”


Race Recap
The 2013 Debt Free Direct Tour de Personal Finance began on June 26th (a few days before the start of the first Stage of the 2013 Tour de France) with a full complement of 64 participants/blogs (up from 52 in 2012!).
In order to start and finish in the same approximate time period as the actual Tour de France, the competition proceeded quickly through the first round with 8 blogs (4 intermediate sprints) per day. Each sprint was given 3 days for voting to occur throughout the competition.
You can view the complete story of how each Stage played out by viewing the 2013 Debt Free Direct Tour de PF Bracket.
When all was said and done, the ~ 1 month-long event featured the following statistics:
- 22 total Stages
- 36 blog posts, up from 32 in 2012.
- 1,111 total comments/votes – Wow! That is an awesome amount of participation (greater than 2x the 544 from 2012)! Thanks to everyone involved!
- 3,081 page views of Tour de Personal Finance Stages and posts, almost 2x the 1,798 from last year.
- 2,176 unique visitors to Tour de Personal Finance Stages and posts, up from 1,500 last year .
2013 Reflections and Goals for 2014 Tour de Personal Finance
I think that overall, the 2013 edition of this event was finally to the point of being “almost perfect.” I had learned quite a bit in how to host this event by doing it twice before, which was good to draw on in this, the third edition. (Third time’s a charm, right?!)
Listed below are the things that I very much enjoyed about this event the past month/went well:
- It’s enabled me to interact and get to know many new bloggers and readers.
- I’ve learned a lot by reading some of the best articles from each blogger’s site that have participated in this competition.
- I liked how the start and end of the race stages more or less coincided with the start and finish of the 2013 Tour de France (even though we had to start a few days early due to the large number of articles competing).
- Due to a great suggestion by Lance @ Money Life and More from last year, this year, I organized all of the posts by subject matter and grouped them together for the first round. That worked pretty nicely, and I’ll keep that going forward for next year!
- We did a great job this year at increasing awareness of the prizes and charity donations on offer to the winners of the competition.
- To do this, we included the prize information on pretty much every stage post article and also on each and every notification email sent out the participants. Even though this probably seemed like a broken record after a while, I do think that the repetition helped, so I’ll be looking to repeat that in coming years (which all hinges on needing to finalize the prizes early on).
- We were able to get a larger number of blogs involved in the event this year (64 vs. 52 blogs/articles last year). This was really great since it enabled all of the brackets to be nice and rounded out! Super stuff!
- I figured out that the key to getting the target number of 64 is to start early.
- This year, I started opening up submissions the first week of June and just barely got in a couple by the deadline for the event to start because of summer vacations and all.
- As such, I think that next year, I’ll start opening up submissions in mid May for the July event start date.
- We were able to get several sponsor partners on board this year.
- Again, the key here was getting an early start.
- I started sending out the details for this the first week of May for the July start to the event. I think that timing worked just about right, and will be looking to repeat that next year!
- A big thanks to all our supporters this year!
Listed below are some things that I see as areas for improvement:
- Spreading the competition’s prizes out a little more among the podium finishers (and maybe even the other Jersey winners if feasible).
- This year, as you might have noticed, it was sort of “all of nothing” when it came to the prizes in the competition since the Yellow Jersey was the only podium placing I planned on giving awards to.
- However, due to the amount of work it can take to get to 2nd or 3rd place in the competition, it definitely makes things jive a little better to spread out the prizes a little more between the top winners. I’ll be looking to incorporate in to the 2014 event from the very beginning instead of adding it in on the backside.
How about you all? What did you think of the 2013 Tour de PF? What would you like to see the different or the same for next year’s event?
Share your experiences by commenting below!
***Photo courtesy of http://upload.wikimedia.org/wikipedia/commons/5/59/Tour_de_Romandie_2013_2013_-_Stage_5_-_Christopher_Froome.jpg