

- You are here:
- Home »
- Blog »
- Invest & Retire »
- GainsMaster Investing and Market Timing Approach – Does It Work Or Is It Futile Like All The Others?
Groups I Am a Part Of


GainsMaster Investing and Market Timing Approach – Does It Work Or Is It Futile Like All The Others?
If you’ve been reading MPFJ for a while, you’ve probably heard me mention before that I am not a big advocate of people investing large amounts of their own money in active management/market timing, either through the buying and selling of individual stocks yourself, following the advice of a newsletter, with the help of a “professional” investment advisor, or through an actively managed mutual fund.
Having said this, I do find it fascinating to learn about and test out techniques people have developed which claim to be able to “beat the market.” While these methods often seem sound and look good in historical analyses, in real-life practice, these methods fail. For example, I did a 6 month test run of Phil Town’s Rule # 1 investing system, which showed that its usage did not deliver a market beating return due to the trading commissions involved).
Recently, I was reading yet individual stock market investing book called, Invest to Win. This book describes a strategy to investing called the GainsMaster Approach (of course you have to trademark a fancy name when you come up with a strategy for investing so it sells better, haha). Reading through the book, the logic seems sound. However, as we often see with efficient markets, logic does not guarantee that you will be able to outperform the overall stock market.
Anyhow, since the logic seemed sound and the technique very interesting to me, I figured I would give the GainsMaster Approach a detailed run-through to see if it has merit!
The first step in the GainsMaster Approach to individual stock investing is to determine if the overall market is in a GO (bull) state or STOP (bear) state, so essentially timing is the market is going up or down in the near future. This post will be dedicated to discussing the signs associated with this market timing portion of the GainsMaster Approach.
Let’s get started!
Step 1 – Evaluate Whether the Current Price of the S&P 500 Index Has Crossed ABOVE or Crossed BELOW the 12-Month Moving Average
As discussed in the title, the first step in the GainsMaster market timing method is to pull up the S&P500’s 12-month (or 252 trading day) Simple Moving Average on a chart and compare the current S&P500 price.
- If the current S&P500 price crosses ABOVE the 12 month moving average, this is a bullish/GO sign.
- If the current S&P500 price crosses BELOW the 12 month moving average, this is a bearish/STOP sign.
The current chart for the S&P500 is shown below. I obtained this from Sogotrade.com, but this data can be obtained for free from almost any financial website like Google Finance, Yahoo Finance, MSN Money, etc. The red line is the 252 day / 12 month Simple Moving Average. As you can see, the S&P500 index crossed ABOVE the moving average (red) line, meaning that the market is probably in a GO mode.

Step 2 – Determine if the S&P 500 Index Average True Range (ATR) Has Been Increasing or Decreasing Over The Past Two Months to Gauge Current Market Volatility
Next, the GainsMaster Approach recommends examining the S&P500 Index’s Average True Range to assess the level of nervousness/volatility in the market. In times of upward market trends, investors are generally less nervous. The opposite is true before a big downturn in the market.
Personally, I hadn’t heard of the ATR before reading this book, but I learned that the True Range is the difference between highest and lowest prices traded during a single day. The Average True Range is the average of the daily True Range value over a certain time period, usually 14 days.
Below are the signs we’re looking for:
- A GO (bull) sign is indicated by the 14-Day ATR showing a downward trend (decreasing nervousness/decreasing volatility) over the past 2 months.
- A STOP (bear) sign is indicated by the 14-Day ATR showing an upward trend (increasing nervousness/increasing volatility) over the past 2 months.
ATR data is a little trickier to find than the other indicators described in this post. Unfortunately, I did not see that the usual finance sites like Google Finance and Yahoo Finance had ATR data. The authors of the GainsMaster Approach recommend that you look to your online brokerage for ATR data. For me, I found this data in my Sogotrade.com online account. In searching around the Internet, I found that you can also access this data for free (already compiled in chart format for the S&P500) by clicking here or clicking here. Or, if you’re a math nerd like me, you can click here to learn how to calculate it for yourself from historical price data.
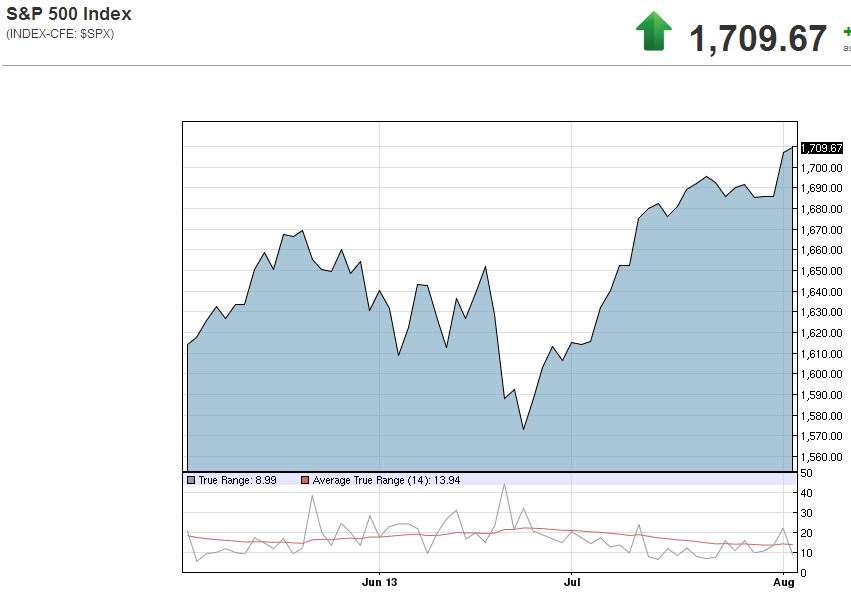
The ATR chart for the current S&P500 index is shown below. The red line in the small bottom graph is the 14 day ATR. As you can see, during the past two months, the ATR has decreased slightly. This is a GO sign!
Step 3 – Gauge Safety-Seeking Behavior By Assessing Whether the S&P500 Index Has Over- or Under-Performed the Dow Jones Utility Average (DJU) Over The Past 2 Months
Prior to a change in market mood, the authors explain that there is almost an accompanying change in the preference of investors’ safety-seeking behavior.
Since utility stocks are stable and pay good dividends, they are often used by investors who feel the markets are dangerous at the current time and want safety. On the other hand, when investors feel the market is strong, they will be investing in regular stocks.
Thus, the GainsMaster Approach recommends keeping an eye on the relative performance of the S&P500 Index (proxy for regular stocks) vs. the Dow Jones Utility Index / Average (proxy for utility stocks). Specifically, we are looking for the following signs.
- GO (bull) Sign = When the S&P 500 index is outperforming the Dow Jones Utilities Index over the past two months
- STOP (bear) Sign = The Dow Jones Utilities index is outperforming the S&P 500 Index over the past two months
You can quickly generate a graph of this 2 month performance comparison in Google Finance. The current comparison chart is shown below. As you can see in the graph, the DJU has outperformed the S&P500 over the past 2 months by a narrow margin, so this is a STOP sign (although a weak one).

Step 4 – Put All of The Indicators Together to Time the Market – Assess Weekly or Monthly
Having gone through all of the mechanics of how this potential market-timing technique works, let’s now just briefly review how it should be executed, as recommended by the developers of the GainsMaster Approach.
- Periodically (I’m going to monitor weekly), watch for a crossing of the 12-month moving average of the S&P500 Index, as explained in Step 1.
- If there is not currently a crossing, just assume that the current market trend (GO/bull currently as of 3-August-2013) will continue.
- If there is a crossing of the 12 month moving average, proceed as described below:
- If there is a crossing of the 12-month moving average, evaluate the Average True Range (Step 2 above) and Dow Jones Utility Average (Step 3) trends described previously.
- Remember that BOTH Average True Range and Dow Jones Utility Average Steps have to show a GO or STOP sign that MATCHES the 12-month moving average crossing direction to indicate a change in the market mood.
- If the 12-month moving average crosses with one signal, but is not confirmed by BOTH of the same signals from the ATR and DJU, then expect the current market mood to continue (but you want to keep monitoring the signals weekly to see if a matching GO or STOP signal pops up).
So, Does This Market Timing Strategy Actually Work? – A Look at Past Performance
In the book that details this strategy, the authors claim that this technique would have correctly timed every major market switch since 1990. They even show graphs/data backing up their claim. However, most of the time with these market timing techniques, it is too good to be true. It’s fairly easy to develop a strategy and make it work retrospectively when the data is under your control, but the real test is how it would play out going through it as a normal individual investor.
Anyhow, I wanted to just examine if this claim about being able to correctly predict the market is true.
Unfortunately, when it comes to pulling up the 3 indicators mentioned above, although it is fairly easy to pull them up in graphical format for recent data, it is a little more difficult to find it for historical backtests. Because of this, I had to take the more manual approach and assemble the 252 day simple moving average and 14-day Average True Range myself from S&P500 historical pricing data (obtained from Yahoo Finance) dating back to 1950.
- After calculating these values, I then set Conditional Formatting in Excel to signal me when the current S&P500 price line crossed the 12 month SMA (Step 1 above).
- Once a crossing occurred, I then weekly monitored the ATR (Step 2 above) and DJU (Step 3 above) change trends to determine if the Gainsmaster Approach predicts that I should be in the market (buy/market increasing) or out of the market (sell/market decreasing).
Next, the question became which historical period to analyze. Since the GainsMaster book did not analyze the 1980’s, I decided to focus my analysis on that 10-year period.
The chart below displays the results of when the GainsMaster Approach dictates an investor should be “in” (green highlighted areas) or “out” (red highlighted areas) of the market.
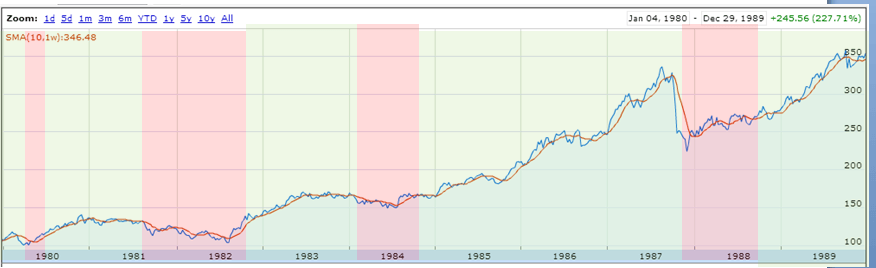
Using the GainsMaster market timing method, you would have been invested in the market during 5 time periods during the 1980’s. While the method seems to be directionally correct in predicting ENORMOUS swings in the market, it doesn’t respond quickly enough all of the time. Additionally, when you’re actually going through this in real-time, it’s impossible to know what is going to be an ENORMOUS swing and what is going to be more subtle.
Let’s take a look at a few examples.
- I will give this method credit that it would have saved investors during the large 1987 market downturn. It dictated getting out of the market on 10/16/1987, and then back in again on 9/26/1988. During this time, the market decreased 5%.
- However, this was really the only time that it was beneficial to use this market timing method vs. passive investing during the 1980’s.
- The GainsMaster approach dictated being out of the market in 1980, 1981-1982, and then again in 1984. During each of these respective periods, the market increased 10%, 7%, and 4% respectively.
- This means that the GainsMaster approach did not work most of the time. It saved you 5% during 1987, but costed you over 20% gains during the rest of the decade.
Overall, if you had invested $10,000 initial investing in an S&P500 index fund on Jan 1st, 1980 and simply held it for ten years, you would have experienced a 206% increase in your money. Conversely, if you had used the GainsMaster approach to market timing, you would have only had an increase on your money of 171%.
If you’re interested in viewing all of the details of my analysis, you can download copy by clicking here.
So, the bottom line here is that GainsMaster market timing Approach, like every other market timing/individual stock picking strategy I’ve seen so far (even though they make logical sense), fails to outperform the market and passive investing with index funds. So, please avoid these strategies and make yourself some real money!
How about you all? Have you ever found a market timing or individual stock investing approach that you think will work, but didn’t end up panning out when you started doing it or got in to analyzing the real data?
Share your experiences by commenting below!
About the Author Jacob A Irwin
Hi folks! My name is Jacob. I am the owner and operator of My Personal Finance Journey. I started this blog in January of 2010 and have enjoyed the journey ever since. Since finishing up graduate school in Virginia in 2014, I have been working in biopharmaceutical development in Colorado. You can read more about me and this site here. Please contact me if you have any questions!
Related Posts
Lifetime Income Strategies: Leveraging Annuities for a Comfortable Retirement
Unlocking the Power of Tax Refund Loans: Accelerating Financial Growth with Smart Borrowing
4 Dumb Mistakes Smart People Make with Their Money
The F.I.R.E. Movement: Is It the Financial Strategy for You?
5 Ways To Start Investing With Less Than $1,000
Popular posts
Session expired
Please log in again. The login page will open in a new tab. After logging in you can close it and return to this page.
I’ve never been interested in trying to time the market. Sure, you may win big occasionally, but chances are you’re going to around and lose all of your previous winnings and possibly more the next time around. Slow and steady wins the race.
Mr. Utopia recently posted…You’re Lazy and That’s Good
Thanks for reading Mr. Utopia. I definitely agree. When I started out investing, I tried foolishly to invest in individual stocks – never really made any money compared to the market.
Jacob A Irwin recently posted…8 Reasons To Always Carry Cash
Fully agree with that, there are plenty of examples of how someone got rich quickly and then lost it all, even though he was applying the very same strategy throughout!
Kostas recently posted…Car Insurance Rates – Seven Factors That Determine Them