

Category Archives for Invest & Retire
Using a Solo 401(k) to Fast Forward Your Retirement Savings
 The following is a post by MPFJ staff writer, Kevin Mercadante, who is a professional personal finance blogger, and the owner of his own personal finance blog, OutOfYourRut.com. He has backgrounds in both accounting and the mortgage industry.
The topic of solo 401(k) plans is usually one of those subjects reserved for small independent business people who are looking to establish a viable retirement plan for their business. It’s not a discussion that comes up often by many other people.
It needs to.
The solo 401(k), called more formally the one participant 401(k), has obvious benefits for anyone who is self-employed, but also great potential for someone who isn’t. More on that last point toward the end.
The plan is available for anyone who is self-employed – even if it is through an S corporation – as long as the business has no other employees. It is a simple plan to manage, with flexible investment options, and generous contribution limits.
But there’s more.
The solo 401(k) hidden advantage
When we think of 401(k) plans, we mostly interpret them through the lens of large employer plans. That means that you are able to contribute a percentage of your income – usually somewhere between 10% and 15% – and the funds accumulate on a tax-deferred basis until retirement. Some employers also offer a partial company match on the employees contribution.
Solo 401(k) plans are similar in the basics, but there’s one advantage they hold over employer-sponsored plans that make them worth investigating for anyone. Under IRS regulations, 100% of the first $17,500 ($23,000 if you‘re 50 or older) can be contributed to the plan.
Got that? 100% – there are no percentage of income limits up to that point.
That means that if you have a small business that earns $50,000 per year, you can contribute the first $17,500 of your income into the plan. If you had an employer sponsored plan that limited you to 10% of your income, your contribution on the same amount of compensation will be just $5,000. That’s a huge difference, and an advantage to the solo 401(k) that most people don’t even know about.
If you are self-employed, this contribution limit is far more generous than it would be for either a traditional or Roth IRA, where your maximum contribution is $5,500, or $6,500 if you’re 50 or older.
But once again, there’s more.
An outsized tax benefit
$17,500 is not only a big chunk of money going into your retirement plan, but it’s also a lot of money to deduct from your income for tax purposes. And that’s only the beginning.
With a solo 401(k), you are both the employee and the employer in your business. That means that you can also have an employer match to your basic employee contribution.
As employer, you can contribute up to 25% of total income to the plan. Let’s say that you earn $50,000 in your business. As the employer, you can contribute $12,500 to the plan (25% of $50,000) for your “employee” – who is also you.
When you add the $12,500 employer contribution to your $17,500 employee contribution, this gives you the ability to contribute up to $30,000 per year. Once again, that’s a lot of money to put into your retirement plan, as well as a huge tax write-off.
Think about it – your business earns $50,000, but 60% of that ($30,000) will not be subject to either federal or state income taxes.
Also think about the impact on your retirement savings of being able to contribute $30,000 per year to your plan. Even if you haven’t saved a single dollar for your retirement up to this point, $30,000 per year will provide a huge advantage in helping you to make up for lost time.
In fact, you can contribute up to $51,000 to the plan each year, limited to $17,500 for the basic employee contribution, plus 25% of total income as the employer contribution.
Setting up a side business – with it’s own solo 401(k)
So far we’ve discussed the potential to fast-forward your retirement savings with a solo 401(k) on a business that represents your primary occupation. But you can also establish a solo 401(k) for a side business.
This is why consideration of a solo 401(k) could be important even if you don’t have a business.
Let’s say that you are 45 years old you have about $50,000 sitting in your employer 401(k) plan. You earn $50,000 per year, and your employer plan limits you to contributions of no more than 10% of your income, or $5,000 per year. Not to be coldhearted, but you’ll never be able to fully retire under those circumstances.
But let’s say that you have the potential to start a side business – or maybe you already have one up and running. Let’s say that you are freelance blog writer, earning an additional $30,000 per year from your side business. If you establish a solo 401(k) plan attached to your writing business, you’ll be able to contribute $17,500 to the plan as an employee, plus an employer contribution of $7,500 (25% of $30,000).
That’s $25,000 in retirement savings, over and above your employer-sponsored plan.
At that rate, a comfortable retirement will be just a matter of time. Not only will this be a much more generous retirement plan contribution then you could get under an IRA, but it will also be fully tax deductible. IRA contributions have a limited tax deductibility if you’re already covered by a plan by your employer.
Starting a side business and attaching a solo 401(k) to it could be a way to either ramp up your retirement savings, or to do a fast catch-up if you haven saved much so far.
How about you all? If you are self-employed, have you checked out the benefits of a solo 401(k) plan? If you’re not self-employed, have you considered the possibility of starting your own side business, and using it to fast-forward retirement savings with a solo 401(k)?
Share your experiences by commenting below!
***Photo courtesy of – http://www.flickr.com/photos/solo_with_others/3011148496/sizes/m/in/
The 72(t) Penalty-Free Distribution From Retirement Accounts – How Does It Apply To You?

 A few months ago, I published an article about a fascinating and useful concept that I have been able to successfully implement this year – The Three Legged Stool for Retirement.
The crux of this whole concept is that we should aim to have built up (by the time of retirement) an approximately equal amount of savings in three different types of accounts (legs) – tax free (Roth-type accounts), taxable (regular accounts), and tax-deferred (401k/traditional IRA accounts). There are two main reasons to have a variety of accounts vs. just one:
- Advantage #1 of The Three Legged Stool – It allows you to adjust/tweak your income sources during retirement so that you can get yourself in the lowest tax bracket possible.
- Advantage #2 of The Three Legged Stool – On the road to retirement, having a mixture of account-types enables you to have money at hand (without penalty and minimal income tax burden) if the need were to arise.
The idea behind today’s post relates to the 2nd advantage above. More specifically, it relates to the fact that with most all retirement accounts (IRA’s and 401(k)’s), you generally have to pay a 10% penalty to access your money before the age of 59.5. For exceptions to this general rule and all the gory details on withdrawal rules, check out my previous post on the different retirement account options.
Thanks to a reader comment in the Three Legged Stool post, the idea was brought up that you could actually get around this 10% penalty on early withdrawals by using something called the 72(t) rule.
The goal for this post will be to examine briefly what the 72(t) rule is (because it is no doubt defined well by other writers previously) and how I think it should affect us as savers for retirement trying to establish our Three Legged Stool. Let’s get started!
What is the 72(t) Distribution Rule?
As eluded to above, the 72(t) distribution rule allows a person to withdraw funds from a retirement account (401(k), IRA, annuity, etc) before the age of 59.5 while avoiding the normal 10% penalty that applies.
The rule dictates that in order to qualify for this exemption, you must take [Substantially] Equal Periodic Payments (SEPP’s) at least annually in such a way that the entire balance of your retirement account is depleted over your remaining life expectancy. While there are many other fine details to be aware of, I will stick to the brief description here and refer you to some great resources I found below:
- Excellent 72(t) Articles You Should Read to Learn More!
- Oblivious Investor
- Good Financial Cents
- Retire by 40
- Money Crashers
- BankRate.com Calculator to decide which payment calculation method is best for you.
Questions Applying The 72(t) Rule To Real Life
Having read through the articles above, there are three primary questions I would have if I was personally going to employ the 72(t) in my life. In order to help others that may also have similar questions, I’ll discuss the answers to these below. Luckily, the remedies all seem pretty straight-forward and available.
Question #1 – Is it possible to use the 72(t) exemption rule if you only want to withdraw a small amount of money from your retirement account (not the entire balance as the rule states)?
Although the 72(t) rule does indeed state that you must take the equal periodic payments in such a way that the ENTIRE retirement account balance is depleted over your remaining life, there is a fairly easy fix to get around this by using or opening up multiple retirement accounts.
As WealthPilgrim explains, you can choose to only apply the 72(t) distributions to one of your retirement accounts (not all of them).
What this means is that if, for example, you only want to withdraw $10,000 of the $100,000 you have saved in your Vanguard IRA, you can achieve this by rolling over the $90,000 you want to keep saving in to an existing or new IRA (has to be prior to starting the equal periodic distributions) and then execute the 72(t) distribution to deplete the entire remaining $10,000 balance in your first IRA.
Question # 2 – Do you have to be officially “retired” or “separated from service” to qualify for the 72(t) distribution rule?
In short, the answer to this question is Yes and No. Here’s why:
- For IRAs, no, you do not have to be retired and/or separated from service. 72(t) can be used at any time for IRAs.
- For qualified plans such as 401(k)’s, yes, you do have to separate from service from your employer before taking a 72(t).
Question # 3 – Can you still contribute to a retirement account after/while taking 72(t) distributions?
Thanks to the feature discussed in Question #1 about being able to elect to use 72(t) distribution on only select (not all of your) retirement accounts, there is a fix for this as well.
- According to eHow.com, if you’re taking 72(t) withdrawals from one retirement account, you can not make any more contributions to that same account in order to still be exempt from the 10% penalty.
- However, you can still contribute to A SEPARATE RETIREMENT ACCOUNT at the same time you are taking 72(t) withdrawals from the 1st account.
- So, simply open up a new IRA to contribute to or contribute to a separate existing IRA.
Conclusion / How This Applies to My Three Legged Stool for Retirement
To sum up the 72(t) distribution rule, I will conclude that it falls in the category of “a nice, workable feature to know about in an emergency/unexpected situation to access retirement money, but not something that is likely to affect my long-term financial planning.”
The reason for this is two fold:
- First, while the 72(t) distribution is nice in letting you avoid the 10% early withdrawal penalty, it does not shield you whatsoever from the more potent 25-45% tax burden that you’ll have to pay for accessing the retirement money early (with the exception of Roth and annuity contributions).
- Second, and more importantly, the 72(t) rule doesn’t help you at all during retirement at managing your income tax bracket by taking income from different types of accounts.
How about you all? Have you ever done a 72(t) distribution from a retirement account or know anyone that has? Did the process go smoothly, or did something unexpected come up?
Does the 72(t) rule affect your long-term financial planning process?
Share your experiences by commenting below!
***Photo courtesy of http://www.flickr.com/photos/rvw/116017204/sizes/m/in/photostream/
Is It Time To Refinance My Adjustable Rate Mortgage?

 The following post is by MPFJ staff writer Travis. Travis is a customer blogger for Care One Debt Relief Services, and also appears weekly at Enemy of Debt. Travis candidly shares his personal journey to pay off $109,000 of credit card debt and the tips he’s learned along the way. As a father and husband he provides a unique perspective on balancing debt, finances, and family.
We built our home in 2004, at the tail end of the housing boom. Mortgage lenders did creative financing to get borrowers into as large of a home as possible because with home prices skyrocketing, you could make money hand over fist by selling your home a few years later.
We were no exception.
Creating Financing
Our first mortgage is an adjustable rate mortgage (ARM) which stayed at a constant rate for the first 5 years, and then adjusted once a year, on July 1st. Our second mortgage was set up as a 10 year interest only home equity line of credit. This setup made our monthly payment as low as possible for the following reasons:
1.) The fact that our first mortgage was for 80% of the home’s appraised value allowed us to take advantage of a loophole to not pay Personal Mortgage Insurance (PMI).
2.) The interest rate on our first mortgage (which was an ARM) was low
3.) Our second mortgage was interest only
Mortgage Treatment
ARMs generally have a bad reputation, but to be honest ours has treated us very well. After the initial 5 years when the rate remained constant, it has adjusted 5 times. The first four adjustments actually decreased our mortgage interest rate resulting in a lower payment each year. This year, the rate stayed constant at 2.875%. In comparison, a 30 year fixed rate mortgage available through my bank according to their website is currently 4.375%.
The second mortgage is a different story. While it has kept our payment low, we haven’t paid any principal on 20% of the money we borrowed back in 2004.
The Refinance Question
Our ARM can adjust upward at most 2% in a single year, with a maximum interest rate of 9%. Due to the way the rate is calculated, interest rates would have to go up quite a bit for our mortgage to increase the maximum. However, economic indicators seem to indicate that the economy is on the mend, even if it is a slow recovery. Which means mortgage interest rates, including our ARM, may be on the rise.
So we have decided to talk to a mortgage representative at our bank about refinancing for the following reasons:
1.) While all mortgage rates are still very low relative to history, I don’t want to wait until rates increase dramatically and the jump from what we have now to a fixed rate gets larger.
2.) Our interest only home equity loan will soon be converted to a fixed rate loan that is at a higher rate than the typical 20 or 30 year mortgage.
It seems to me that we are in for a mortgage payment increase if we just let things continue down their current path. The worst part is that the amount of increase is unknown until we get closer to the adjustment date of the first mortgage, and the conversion date of the second mortgage.
Uncertainty makes it very difficult to build a budget, and that makes me very nervous. I’m done playing the market and hoping that the ARM adjusts in our favor. It’s time to lock in and know exactly where we’re at.
How about you readers, have you refinanced recently? Do you have an ARM? Do you think the time is right to refinance?
Share your experiences by commenting below!
Why I’m Renting For 10 More Years

 The following post is by MPFJ staff writer, Catherine Alford. Cat is a freelance personal finance writer who blogs at www.BudgetBlonde.com.
All around me, friends and family members who are my age are buying houses, but there’s just no way I’m ready for that yet. I’m actually a little bit jealous of them because houses mean putting down roots and getting nice and settled in life.
However, even though I’m craving some stability, I would never take back the experiences I’ve had over the past two years. Moving to the Caribbean was the opportunity of a lifetime, and it’s completely changed my life in more ways than one. Now that this journey is coming to a close, it’s time to look towards the future, leave the apartment we’ve called home for so long, and move on to a different life.
However, we are definitely still going to rent, probably for about 10 more years, and here’s why:
1. We’re Moving Too Much
Like I said previously, in just a few months, my husband and I are moving back to the United States. Then, a few months after that, we are moving to a totally new city. We have no idea what that city that will be, but his medical school will notify us 4 weeks ahead of the move date. We’ll live in that city for two years, and then my husband will do residency interviews. Again, we won’t know where we’ll be living until match day (where 4th year medical school students find out where they will be completing their residencies.) Then, we’ll move again for 3-4 more years and possibly again if my husband wants to do a fellowship.
Not only is that a crazy amount of school and training, but it’s a lot of moving. The housing market, although it’s getting stronger, is still to delicate for me to be interested in making an investment and hoping to sell in just two years. Even during the height of the real estate boom, houses still needed a few years to really, truly appreciate enough to make a profit.
2. We Want to Make a Huge Down Payment
When I buy a house, I want it to be a really comfortable financial decision. I don’t want to agonize over closing costs or fixing a water heater or buying a new roof. I want to have enough money saved to put more than 20% down. Also, I do not want to take out such an enormous loan without a massive savings account that’s there for emergencies.
Plus, if you think about it, we’ve already purchased a big, imaginary house with my husband’s medical school loans, and we’re really going to have to concentrate on paying off the $300,000+ that we’ve accrued. While some people will pay off mortgages at that price, we have to pay off my husband’s education before even thinking about taking out an amount that big again.
3. Landlords Handle the Difficult Tasks
Being married to someone in the medical field is much like being married to a police officer or a firefighter. Their schedules are crazy and hard to predict. If there is something that needs to be fixed in the house, chances are my husband won’t be able to help me. For that reason, it’s extremely convenient to rent because a landlord is responsible for all of the big repairs. Sure, we are helping them build their investment without making one of our own. However, they would be giving us much needed peace of mind, something that we desperately need during this hectic time in our lives.
4. It Makes It Easy To Explore & Move
Even though there are many downsides to moving constantly, it can also be fun and exciting. Renting, although there are contracts, is much less permanent than buying a home. If a new work opportunity came up or my husband wanted to do a fellowship across the country, we could pick up and do that. In many ways, I feel like owning a home weighs you down and prevents you from freely pursing many opportunities. I’m sure there is a great feeling of ownership when you have a piece of Earth to call your own, but for right now, I’m craving the ease and flexibility of a rental.
I truly hope to be a homeowner one day, even though it will be many years down the road. Still, I look forward to finally picking the city that we’ll call home for many years and either finding or building our dream home. I’m still a little jealous of the path that many of my friends have taken in terms of home ownership. Yet, even though their path looks nice and safe, I’m also kind of enjoying my bumpy ride.
How about you all? Do you currently rent? Or, if you are a homeowner, what are some things that you love and hate about it?
Share your experiences by commenting below!
***Photo courtesy of http://www.flickr.com/photos/csessums/4589510413/
How A “Fixer-Upper” House Can Turn Into A Nightmare

The following is a post by MPFJ staff writer, Kevin Mercadante, who is a professional personal finance blogger, and the owner of his own personal finance blog, OutOfYourRut.com. He has backgrounds in both accounting and the mortgage industry.
One of the very best ways to get a r eal deal on a new home is by buying a “fixer upper”. This provides the opportunity to buy a house that’s in less-than-perfect condition, but also at well below the going market rate for similar properties.
But at the same time, the fixer-upper house can turn into a nightmare. Here are some of them, as well as suggestions on how to avoid them.
The biggest problems can be the ones you don’t see
An ideal situation is to buy a house that is only in need of cosmetic repair. But, cosmetic repairs can hide other problems. There can be significant structural problems behind the cosmetic ones that you won’t discover until you’re in the property and making the repairs.
This happens because fixer-upper’s typically come to the market following a period of neglect. This is easy to see when you consider the typical situations that bring a fixer-upper to the market:
- A foreclosure
- A distressed sale
- An estate sale
In each of the above situations, it is highly likely that the sale of the property was preceded by a prolonged period – perhaps several years – where the previous owner lacked either the physical capability or the financial wherewithal to properly maintain or repair it. As a result, small problems became big problems, and big problems are often the reason why the property is being sold.
Whatever the purpose that is driving the sale, the seller typically lacks the ability or willingness to make the needed repairs, even as a requirement of sale. If you’re buying a fixer upper, the burden of making necessary repairs will be squarely on your shoulders.
It can be difficult to get mortgage financing
As a result of all the above, it is often difficult to get mortgage financing on a fixer-upper property. In order to grant a mortgage on any property, lenders require that the property has no significant issues in regard to safety or livability. Unfortunately, the fixer-uppers often have problems on both fronts.
So much of your ability to get the mortgage on such property will depend upon a specific condition of the house. If the problems are primarily cosmetic, you will generally be able to get financing without issue. But if there’s anything more significant, financing will be anywhere from difficult to impossible to obtain.
Borrowing money to finance repairs is close to impossible
One of the biggest problems in buying a fixer-upper is that you’ll need a significant amount of cash even after you close on the house. This will be especially true if you are unable to perform many or most of the necessary repairs yourself. Borrowing money through a home equity line of credit or a second mortgage on a property that is essentially damaged goods will be more difficult than getting the purchase money first mortgage.
If you’re buying a fixer-upper, you should obtain a finely detailed home inspection report – at a cost of several hundred dollars – before closing on the property. The home inspection will tell you specifically what is wrong with the property, but it can also give you a list of what it will cost to remedy them. Pay close attention to these costs – whatever you cannot fix on your own, you’ll have to pay for – out of your own resources.
Even though a fixer-upper may ultimately be a better investment value, it generally will require more money up front than buying a house in better condition.
The house may not be immediately livable, rentable or salable
Once again, the specific condition of the property is most important. It is possible that the house may not even be livable, if you are planning on occupying it. But if you’re planning to buy it as a rental, or to quickly flip it at a profit, your plans will go up in smoke if the house is neither rentable nor sellable. How quickly after the sale you’ll be able to get the house into an acceptable condition will be part of your success or failure in the venture.
DIY repairs could turn into a full-time job
If you do plan to do most of the work on the house yourself, you need to give yourself a realistic estimate as to how long this will take. Fixing the property could turn into the equivalent of full-time job, and if you have a demanding occupation to begin with, you may not have the time that you need to do the work that needs to be done.
And on the topic of time, whatever amount you estimate you will need to fully repair the property, double it! Deferred maintenance usually means that the depth of repair work will be greater than you initially estimate. For example, when going to replace rotted drywall, you may find the studs behind are also rotted. Now you’re no longer repairing a wall, but tearing it down and replacing it. The situation is not at all uncommon with fixer-upper’s.
The house could become a money pit
This is the nightmare scenario that could develop as a result of buying fixer-upper. The property can turn out to be more deteriorated than your early expectations, and require both more time and money than you budgeted for the project.
Worse, you may discover issues with the property that were either undiscovered or unknowable at the time of the home inspection. For example, recently installed wood paneling in the basement could hide the fact that the basement is subject to flooding. And you may not learn until you began tearing down walls that the house has structural deficiencies that will cost many thousands of dollars to fix.
If you do plan to buy a fixer-upper, here are a few things that you’ll need to make the project a success:
- An extremely accurate idea of what the real value of the property is – a house is not a bargain just because it is a fixer-upper and you should be able get it for well below the prevailing market.
- A very detailed home inspection, from a trusted inspector.
- Any supplemental inspections that the home inspector recommends (don’t cut corners here!)
- A pile of cash, or access to a pile of cash, to cover at least twice the expected repair costs.
- The ability to perform the repair work yourself.
- The time to do the repair work yourself.
- Realistic expectations as to the amount of money that it will cost, the time will take, and how long it will be before you can recover your investment.
Armed with each of the above, a fixer-upper can be an excellent investment. But, if you’re missing even one or two, take your time and get them before proceeding.
How about you all? Have you ever purchased a fixer-upper house? How did it work for you? What would you recommend to someone who is planning on buying one?
Share your experiences by commenting below!
***Photo courtesy of http://www.flickr.com/photos/29766902@N00/387371265/
GainsMaster Investing and Market Timing Approach – Does It Work Or Is It Futile Like All The Others?

If you’ve been reading MPFJ for a while, you’ve probably heard me mention before that I am not a big advocate of people investing large amounts of their own money in active management/market timing, either through the buying and selling of individual stocks yourself, following the advice of a newsletter, with the help of a “professional” investment advisor, or through an actively managed mutual fund.
Having said this, I do find it fascinating to learn about and test out techniques people have developed which claim to be able to “beat the market.” While these methods often seem sound and look good in historical analyses, in real-life practice, these methods fail. For example, I did a 6 month test run of Phil Town’s Rule # 1 investing system, which showed that its usage did not deliver a market beating return due to the trading commissions involved).
Recently, I was reading yet individual stock market investing book called, Invest to Win. This book describes a strategy to investing called the GainsMaster Approach (of course you have to trademark a fancy name when you come up with a strategy for investing so it sells better, haha). Reading through the book, the logic seems sound. However, as we often see with efficient markets, logic does not guarantee that you will be able to outperform the overall stock market.
Anyhow, since the logic seemed sound and the technique very interesting to me, I figured I would give the GainsMaster Approach a detailed run-through to see if it has merit!
The first step in the GainsMaster Approach to individual stock investing is to determine if the overall market is in a GO (bull) state or STOP (bear) state, so essentially timing is the market is going up or down in the near future. This post will be dedicated to discussing the signs associated with this market timing portion of the GainsMaster Approach.
Let’s get started!
Step 1 – Evaluate Whether the Current Price of the S&P 500 Index Has Crossed ABOVE or Crossed BELOW the 12-Month Moving Average
As discussed in the title, the first step in the GainsMaster market timing method is to pull up the S&P500’s 12-month (or 252 trading day) Simple Moving Average on a chart and compare the current S&P500 price.
- If the current S&P500 price crosses ABOVE the 12 month moving average, this is a bullish/GO sign.
- If the current S&P500 price crosses BELOW the 12 month moving average, this is a bearish/STOP sign.
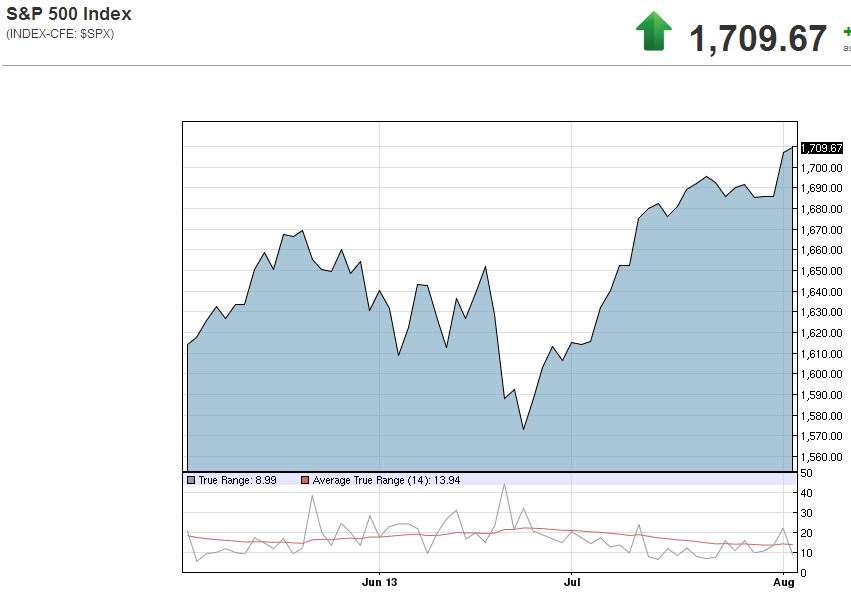
The current chart for the S&P500 is shown below. I obtained this from Sogotrade.com, but this data can be obtained for free from almost any financial website like Google Finance, Yahoo Finance, MSN Money, etc. The red line is the 252 day / 12 month Simple Moving Average. As you can see, the S&P500 index crossed ABOVE the moving average (red) line, meaning that the market is probably in a GO mode.

Step 2 – Determine if the S&P 500 Index Average True Range (ATR) Has Been Increasing or Decreasing Over The Past Two Months to Gauge Current Market Volatility
Next, the GainsMaster Approach recommends examining the S&P500 Index’s Average True Range to assess the level of nervousness/volatility in the market. In times of upward market trends, investors are generally less nervous. The opposite is true before a big downturn in the market.
Personally, I hadn’t heard of the ATR before reading this book, but I learned that the True Range is the difference between highest and lowest prices traded during a single day. The Average True Range is the average of the daily True Range value over a certain time period, usually 14 days.
Below are the signs we’re looking for:
- A GO (bull) sign is indicated by the 14-Day ATR showing a downward trend (decreasing nervousness/decreasing volatility) over the past 2 months.
- A STOP (bear) sign is indicated by the 14-Day ATR showing an upward trend (increasing nervousness/increasing volatility) over the past 2 months.
ATR data is a little trickier to find than the other indicators described in this post. Unfortunately, I did not see that the usual finance sites like Google Finance and Yahoo Finance had ATR data. The authors of the GainsMaster Approach recommend that you look to your online brokerage for ATR data. For me, I found this data in my Sogotrade.com online account. In searching around the Internet, I found that you can also access this data for free (already compiled in chart format for the S&P500) by clicking here or clicking here. Or, if you’re a math nerd like me, you can click here to learn how to calculate it for yourself from historical price data.
The ATR chart for the current S&P500 index is shown below. The red line in the small bottom graph is the 14 day ATR. As you can see, during the past two months, the ATR has decreased slightly. This is a GO sign!
Step 3 – Gauge Safety-Seeking Behavior By Assessing Whether the S&P500 Index Has Over- or Under-Performed the Dow Jones Utility Average (DJU) Over The Past 2 Months
Prior to a change in market mood, the authors explain that there is almost an accompanying change in the preference of investors’ safety-seeking behavior.
Since utility stocks are stable and pay good dividends, they are often used by investors who feel the markets are dangerous at the current time and want safety. On the other hand, when investors feel the market is strong, they will be investing in regular stocks.
Thus, the GainsMaster Approach recommends keeping an eye on the relative performance of the S&P500 Index (proxy for regular stocks) vs. the Dow Jones Utility Index / Average (proxy for utility stocks). Specifically, we are looking for the following signs.
- GO (bull) Sign = When the S&P 500 index is outperforming the Dow Jones Utilities Index over the past two months
- STOP (bear) Sign = The Dow Jones Utilities index is outperforming the S&P 500 Index over the past two months
You can quickly generate a graph of this 2 month performance comparison in Google Finance. The current comparison chart is shown below. As you can see in the graph, the DJU has outperformed the S&P500 over the past 2 months by a narrow margin, so this is a STOP sign (although a weak one).

Step 4 – Put All of The Indicators Together to Time the Market – Assess Weekly or Monthly
Having gone through all of the mechanics of how this potential market-timing technique works, let’s now just briefly review how it should be executed, as recommended by the developers of the GainsMaster Approach.
- Periodically (I’m going to monitor weekly), watch for a crossing of the 12-month moving average of the S&P500 Index, as explained in Step 1.
- If there is not currently a crossing, just assume that the current market trend (GO/bull currently as of 3-August-2013) will continue.
- If there is a crossing of the 12 month moving average, proceed as described below:
- If there is a crossing of the 12-month moving average, evaluate the Average True Range (Step 2 above) and Dow Jones Utility Average (Step 3) trends described previously.
- Remember that BOTH Average True Range and Dow Jones Utility Average Steps have to show a GO or STOP sign that MATCHES the 12-month moving average crossing direction to indicate a change in the market mood.
- If the 12-month moving average crosses with one signal, but is not confirmed by BOTH of the same signals from the ATR and DJU, then expect the current market mood to continue (but you want to keep monitoring the signals weekly to see if a matching GO or STOP signal pops up).
So, Does This Market Timing Strategy Actually Work? – A Look at Past Performance
In the book that details this strategy, the authors claim that this technique would have correctly timed every major market switch since 1990. They even show graphs/data backing up their claim. However, most of the time with these market timing techniques, it is too good to be true. It’s fairly easy to develop a strategy and make it work retrospectively when the data is under your control, but the real test is how it would play out going through it as a normal individual investor.
Anyhow, I wanted to just examine if this claim about being able to correctly predict the market is true.
Unfortunately, when it comes to pulling up the 3 indicators mentioned above, although it is fairly easy to pull them up in graphical format for recent data, it is a little more difficult to find it for historical backtests. Because of this, I had to take the more manual approach and assemble the 252 day simple moving average and 14-day Average True Range myself from S&P500 historical pricing data (obtained from Yahoo Finance) dating back to 1950.
- After calculating these values, I then set Conditional Formatting in Excel to signal me when the current S&P500 price line crossed the 12 month SMA (Step 1 above).
- Once a crossing occurred, I then weekly monitored the ATR (Step 2 above) and DJU (Step 3 above) change trends to determine if the Gainsmaster Approach predicts that I should be in the market (buy/market increasing) or out of the market (sell/market decreasing).
Next, the question became which historical period to analyze. Since the GainsMaster book did not analyze the 1980’s, I decided to focus my analysis on that 10-year period.
The chart below displays the results of when the GainsMaster Approach dictates an investor should be “in” (green highlighted areas) or “out” (red highlighted areas) of the market.
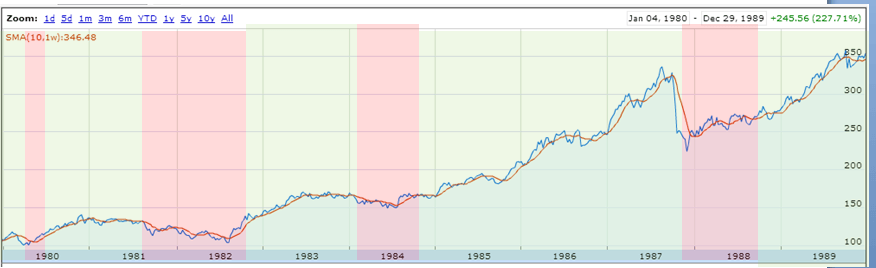
Using the GainsMaster market timing method, you would have been invested in the market during 5 time periods during the 1980’s. While the method seems to be directionally correct in predicting ENORMOUS swings in the market, it doesn’t respond quickly enough all of the time. Additionally, when you’re actually going through this in real-time, it’s impossible to know what is going to be an ENORMOUS swing and what is going to be more subtle.
Let’s take a look at a few examples.
- I will give this method credit that it would have saved investors during the large 1987 market downturn. It dictated getting out of the market on 10/16/1987, and then back in again on 9/26/1988. During this time, the market decreased 5%.
- However, this was really the only time that it was beneficial to use this market timing method vs. passive investing during the 1980’s.
- The GainsMaster approach dictated being out of the market in 1980, 1981-1982, and then again in 1984. During each of these respective periods, the market increased 10%, 7%, and 4% respectively.
- This means that the GainsMaster approach did not work most of the time. It saved you 5% during 1987, but costed you over 20% gains during the rest of the decade.
Overall, if you had invested $10,000 initial investing in an S&P500 index fund on Jan 1st, 1980 and simply held it for ten years, you would have experienced a 206% increase in your money. Conversely, if you had used the GainsMaster approach to market timing, you would have only had an increase on your money of 171%.
If you’re interested in viewing all of the details of my analysis, you can download copy by clicking here.
So, the bottom line here is that GainsMaster market timing Approach, like every other market timing/individual stock picking strategy I’ve seen so far (even though they make logical sense), fails to outperform the market and passive investing with index funds. So, please avoid these strategies and make yourself some real money!
How about you all? Have you ever found a market timing or individual stock investing approach that you think will work, but didn’t end up panning out when you started doing it or got in to analyzing the real data?
Share your experiences by commenting below!
Issues With 401k Plans And How To Compensate For Them

 The following is a post by MPFJ staff writer, Toi Williams, who is a personal finance blogger over at Fine Tuned Finances. She has backgrounds in personal finance, sales, and real estate.
Over the past decades, the defined-benefit pension plan has been replaced with the 401k plan as the dominant retirement plan saving vehicle for most workers in the United States.
While 401k plans give the workers more control over their retirement income by allowing workers to save more for retirement and decide which investments to include in their plans, there are a number of issues that have arisen with these plans over the years that workers should be aware of. Some of these issues require additional actions to compensate for the issue while other issues should be avoided completely if possible.
Here are the issues that you should be aware of regarding 401k plans and how to compensate for them:
Long Time Horizons For Investments
One of the biggest issues found with 401k plans is that there are extremely long time horizons for your investments, making it very difficult to choose the best investments for your plan. Developing a long-term strategic asset allocation based on a time horizon that will typically exceed a decade in length is complicated enough, but adding in the fact that the portfolio managers and the funds available in the plan are likely to change during that time makes smart investing even harder. You will have to find the balance between the shorter-term tenure of the portfolio managers and the longer-term investment holding period.
Many investors use index funds to make that balance. However, if there are not many index funds offered in your 401(k) plan, you have a couple of other options that can be used to address this problem. One option is to develop a tactical asset allocation contingency plan that can be put into place in the event one of your portfolio managers relinquish responsibility. Another option is to open a traditional IRA or Roth IRA that has index fund strategies that are not available in your 401k plan and contribute up to the legal limit.
Flaws In The Structure Of The Plans
There are a number of structural flaws in 401k plans that can be devastating to the unwary investor. Many people invest in their 401k accounts using the dollar cost averaging methodology, meaning that they buy a fixed dollar amount of a particular investment on a regular schedule regardless of the share price, which they believe will allow them to prudently build their retirement nest egg over time. This is a good method to use when the market is trending up, but can cause you to lose a significant amount of money when the market is trending down.
Instead of using an automatic investment method like dollar cost averaging, take control of your investing by directing all of your retirement plan contributions into a conservative investment option. Then, you can make a strategic investment allocation of the cash that you have accumulated into a promising fund offered in your 401k plan when the time is right. The investments chosen for your 401k plan are your responsibility, so you should be active in choosing how to allocate your money into different investment choices.
Fees And Administrative Charges
Many employer-sponsored 401k plans are expensive. Because of the number of compliance issues that have to be monitored, it is important for the plans to be administered correctly and that can cost a lot of money. The plan administrator is required to conduct a number of ongoing service and administration functions and must provide plan participants with a variety of education and communication services. To pay for these services, many plan participants are charged participant fees, supplemental asset based charges, and other itemized costs for services.
Developing a tailored retirement plan strategy can help you mitigate some of the costs of your 401k plan. Instead of using your 401k as your primary retirement savings vehicle, only contribute to the plan up to the point where you receive 100% of your employer’s matching contribution. Then, you can open a low-cost IRA with a brokerage firm or through a local bank in your area and contribute up to your legal limit. In nearly all cases, the various investment options available through an IRA will be much less expensive than the options available through an employer-sponsored 401k plan.
Recordkeeping Issues
Recordkeeping for the assets accumulated in your 401k plan is a labor-intensive endeavor, even in today’s technological age. In most cases, the records have been generated for many years and may contain errors and omissions due to the mistakes of the people tasked with compiling these records. Typically, retirement plan providers will provide only what the law requires in your statements, and what is required by law may not necessarily be what you need to make an accurate financial assessment of your investment strategy.
If your retirement plan provider does not provide the information you need in an investor-friendly statement, you may want to take care of your recordkeeping yourself. The simplest way to do this is to build a spreadsheet that you can use to track your information. To create your spreadsheet, you can use the important information from your monthly or quarterly statements, such as your beginning account balance, the amount contributed to your retirement plan account by you and your employer, the amount of any transfers or withdrawals made during the period, the amount of any gains or losses experienced and the ending balance of the account. After inputting the information, you can manually calculate your annualized rate of return. This will help you see whether you are on track in terms of meeting your long-term financial goals.
How about you all? What issues have you run into with your 401k plan? What have you done to fix or compensate for them?
Share your experiences by commenting below!
Picture: http://www.flickr.com/photos/76657755@N04/7067724529/
How Do You Analyze Individual Stocks? – Part 2 – The Periodic Check-In

If you’ve been reading MPFJ for a while, you’ve probably heard me mention before that I am not a big advocate of people investing large amounts of their own money in active management, either through the buying and selling of individual stocks yourself, following the advice of a newsletter, with the help of a “professional” investment advisor, or through an actively managed mutual fund.
Why do I shy away from large investments in individual stocks? Simple. Because the track record of individuals (even professionals) selecting individual stocks does not show proof positive that it is worth the cost involved. In fact, 70% of the stock professionals fail to beat out the market, so why would I think I can do this consistently?
Having said that, I do, however, think that analyzing individual stocks for investing using smaller amounts of play money is a fascinating exercise, and it’s something that I would like to believe in. I just haven’t seen proof that it can be done consistently in an efficient manner, but maybe someone will prove me wrong one day and cause me to switch from my current approach of passive investing using index mutual funds and ETFs.
Anyhow, back in February of this year, I did a post sharing my strategy for how I perform the preliminary analysis of individual stocks for potential buying opportunities, using the specific stock, MGT Capital Investments, Inc. (AMEX/NYSE symbol: MGT), as an example.
Today, I wanted to continue this series/investigation by sharing the method that I use for another very important part of the individual stock investing process, the periodic check-in. Again, I’ll be using the stock, MGT Capital Investments, as an example for consistency.
Basically, what we want to do with the periodic check-in process is to compare where the company is now vs. where it was when the preliminary analysis was performed to determine if it still makes sense for you to be holding the stock.
As a brief recap, in my preliminary analysis of MGT’s stock, my conclusion was that since the company has a good business model, strong leader in their CEO, and the recent key financial number change trends were pointing upwards, MGT would be a speculative “buy” when the 3 technical indicators I use turned positive.
Step 1 – 30,000 Foot Elevation View of the Company and Price Performance
To get a very high level overview/update on how the company is doing, I first turn to Google Finance and look up the ticker symbol.
On Google Finance, I specifically am looking at 3 things – 1) price history since I last analyzed the stock and 2) the current financials. I like to use Google Finance for this purpose because all of these items are displayed on a single page, making it very easy to navigate.
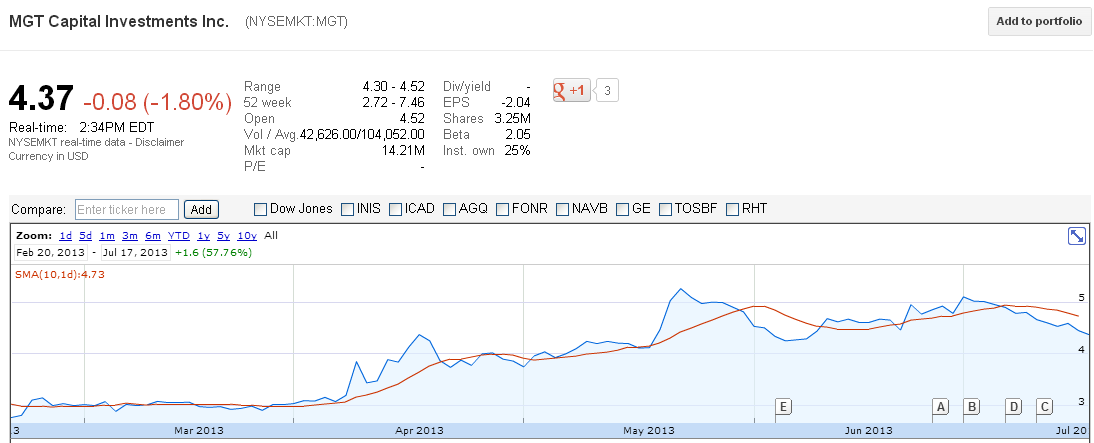
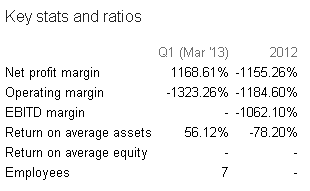
Shown below are these two items for the stock that I’m using as an example, MGT, as well as the appropriate screen shots from Google Finance. I’ve also left in the February 2013 screen shots for comparison as well.
- Since I first assessed this stock on Feb 20th, 2013, MGT has experienced quite a run up in price.
- Between February and now in July 2013, the stock price has increased from $2.85 to $4.37 per share, a growth of close to 60%!
- While this growth was hard to predict exactly, it is not totally surprising, considering the things mentioned in my preliminary analysis about the company having good recent financial change trends.
- Regarding the high-level financial figures, the overall change seems to be positive / in the correct direction.
- Although EPS has decreased, pretty much all of the financials seem to have improved in the past 5 months or so – with market cap, trading volume, shares outstanding, margins, ROE, and ROA all increasing.
- In addition, it also appears that they have downsized two employees, since they now have 7 employees, down from 9 previously. This will be something I want to investigate from a qualitative perspective as well.
- It is also worthwhile to note that MGT still has a very small number of shares outstanding (only 3 million). What this means is that the stock is potentially very ill-liquid / volatile.
 |
| MGT Stock Price History |
 |
| MGT Financials |
Step 2 – See If There Have Been Any Changes Regarding How the Stock Fits Within Phil Town’s Rule # 1 Investing Analysis System
As I mentioned previously in my 6 month test run of Phil Town’s Rule # 1 investing system (which showed that its usage did not deliver a market beating return due to the trading commissions involved), I do not believe that Phil’s system is the “magic formula” for beating the market. However, Phil’s approach does involve some very prudent technical and fundamental analysis which I feel can give me a deeper understanding of how the company is functioning as an investment.
- Phil Town Criteria – Identify if the company has a “moat” – What he explains we are looking for here is >10% annual growth rate over 10 years for the following things: 1) Return on investment capital, 2) sales revenue, 3) EPS growth, 4) Equity per share, and 5) free cash flow growth. We also make sure that the company has enough current free cash flow to be able to pay back it’s long term debt in 3 years or less.
- A great place to get all of this 10 year historical data in one place is Stock2Own.com. If you type in the ticker symbol of the stock you’d like to analyze in the box at the top, it will then automatically calculate all of these five financial ratios for you. These can be accessed by clicking the Annual Statements option on the left sidebar.
- The data for MGT is shown in the attached screenshot below.
- As I mentioned previously for MGT (and as is still the case), the 10-year average financial calculations above do not look very good because of all of the negative values it is carrying, and as such, are definitely NOT in line with Phil Town’s criteria. Return on investment capital (or ROE), EPS growth, and free cash flow growth are all either deeply negative or zero. Furthermore, the company has negative free cash flow,but at the same time, they still have no long term debt.
- At ~31% annual growth over the past 10 years, sales revenue does fit the “moat” criteria.
- At 11.9% annual growth over the past 9 years, Equity per share does fit the “moat” criteria.
- These growth rates are a slight improvement from the way the company looked in February of 2013.
Even though MGT still does not meet the Return on Investment Capital, EPS, and Free Cash Flow moat criteria set forth in the Phil Town method, this is not very surprising because it is a speculative play.
- Phil Town Criteria # 3 – Calculate the appropriate sticker price, or what the stock should be selling at given it’s current EPS and EPS growth rate. We then calculate the Margin of Safety price (MOS) to make sure that we buy the stock at a significant enough (50%) discount to shield ourselves from mistakes and be able to achieve higher returns.
- Fortunately, the tool listed above, Stock2Own.com also has a handy feature that automatically calculates the sticker price (Value Price) and Margin of Safety (MOS) price.
- To view this in Stock2Own, simply click the Value Price option in the left sidebar.
- Unfortunately, for MGT, since their EPS is still negative (as it was back in Feb of this year), a MOS/Value Price cannot be calculated, so we don’t have this gauging point to base our decisions off of.
- In the case of MGT, since their EPS is negative, we also cannot gauge effectively whether or not the stock is now “overvalued” now that the price has increased to around the $4 per share range. In fact, since the EPS is negative, this means that the stock has been OVERVALUED the entire time (even during the preliminary analysis! haha).
- While this is unfortunate, there is not much else we can do but soldier on and make our decision with the other information available to us.
- Phil Town Criteria # 4 – Use technical analysis tools to make sure you are either buying or selling at the right time. Phil recommends using three technical tools to make sure of this – 1) 8-17-9 MACD indicator, 2) 14K, 5D Slow Stochastic Oscillator, and the 3) 10-day moving average. Phil recommends that you only buy when all 3 of the tech. indicators say “buy.”
- To generate these three graphs for a stock analysis, I again use Google Finance. To set it up, you simply click, “Technicals,” at the bottom of any Google Finance stock price history window, and fill out the fields as shown in the below screenshot:
- Once you’ve set up the indicators, view the 3 month history graphs for the stock you’re analyzing. Three months seems to be a good time period in order to clearly see whether the technical indicators are saying “buy” or “sell.”
- For analyzing MGT, the SMA, MACD, and SSTO technicals are all shown on the combined chart below:
- First, the 10 day simple moving average (red line), compared to the actual stock price (blue line). With the simple moving average, a “buy” signal is indicated by when the stock price line crosses above the moving average.
- In the case of MGT, the stock price is currently below the moving average, indicating that we do not want to buy right now.
- MGT’s 14K, 5D Slow Stochastic Oscillator. With the stochastic, the K line (blue) is the “buy” line, and the D line (red) is the “sell” line. With this technical indicator, a “buy” signal is indicated by when the buy/K line crosses above the sell/D.
- In the case of MGT, the K line is currently below the D line, indicating that we do not want to buy right now.
- MGT’s 8-17-9 MACD indicator is shown below. With this technical indicator, a “buy” signal is indicated by when the MACD line crosses above the EMA line.
- In the case of MGT, the MACD appears to have decreased below the EMA, indicating that we do not want to buy right now.
Step 3 – Qualitative Research On The Company, The Management (CEO especially), Current News, and That No Insider Selling Is Happening
As the title above suggests, the next step I take in the periodic check-in is to analyze how the company I’m following is performing compared to when I last researched about it and check in on how the noteworthy events mentioned in my preliminary analysis unfolded. This is also a good time to research any questions that have popped up from the more quantitative investigations discussed above.
Listed below is how I tackle this step, using the stock, MGT, as an example:
- Management Analysis (done through Google Finance and Reuters.com) – As was the case in my preliminary analysis of MGT, the current CEO is still Robert Ladd. He joined the company in 2010 as a director and became CEO in early 2012. This occurred almost exactly the same time at which the stock price for the company increased from almost $0 to $4 per share. There was also a stock split at this same time. At a high level, this appears that the market took the news of a new CEO as good and that Mr. Ladd was assessed as a good leader. Ladd also has a long history of investment analysis, which is important in his role as head of a holding company where he is making investments as his primary business. I also found another article stating that Mr. Ladd is “responsible for rejuvenating the company. As far as I can tell, Ladd continues to do a stellar job at the head of MGT.
- Insider Trading (done through company website or MSN Money) – In looking at the recent transactions of company insiders, the CEO, Robert Ladd, sold off ~5% of his total shares (20,000 shares sold) during mid June 2013 (around $100k worth). This is not necessarily the best thing to see, since it might indicate that the CEO sees the current stock price as the highest it will get for a while. However, Robert Ladd continues to the largest shareholder (with ~400,000 shares), meaning that the management goals are indeed aligned with shareholder benefit. It is still encouraging to note that the management only have reported income that they pay themselves of $200 per year or so, so it appears that their salary is heavily weighted in stock options/stock performance.
- Additional Clarity About What the Company Does/Its Current Position (find the “news” columns on Reuters, Yahoo/Google Finance, etc after you bring up the chart for a specific stock) –
- In reading a May 2013 investor presentation, I found out that MGT acquired a majority stake in April 2013 in an online fantasy sports wagering platform called, Fan Throwdown. In addition, they purchased Hammercat Studios in May 2013, which will eventually give them exposure to earn money from a mobile platform for skills-based game wagering.
- Both of these purchases are encouraging to see, as it represents good growth opportunity potential for the company.
- It also represents a logical diversification stream of revenue in to the sports and skills-based wagering realms to complement their gambling side of the business.
- I had found out during my preliminary February 2013 analysis that MGT is selling off its medical holdings because it did not fit and wasn’t profitable for them. They have decided only to focus on their gaming patent development for now.
- In searching around online, I found out that the company has completed the sale of its medical imaging patents. They were sold to the Samsung Corporation for $1.5 MM. Of this, the company expects to report a gain on the sale of $750k. This is good progress to see!
- This sale of MGT Medical is likely responsible for the decrease in employees from 9 previously to 7 now.
- Finally, the company is still awaiting the Markman Hearing to see if they will get any money from potential patent infringement against one of their gambling patents they own. However, there has apparently been a court date decided. It will be June 5th, 2014, so quite a long time to wait!
- Overall, it seems that the company is at a point where they are building for long-term success. As such, the recent increase in price doesn’t seem to hinge on some high-risk project being undertaken by the company, which is a good thing.
- In reading a May 2013 investor presentation, I found out that MGT acquired a majority stake in April 2013 in an online fantasy sports wagering platform called, Fan Throwdown. In addition, they purchased Hammercat Studios in May 2013, which will eventually give them exposure to earn money from a mobile platform for skills-based game wagering.
Step 4 – Review and Decision Hold, Buy More, or Sell Your Current Positions
Having now completed all of the steps I do in the periodic check-in, it is time to review what has been seen and decide if I would hold or sell shares I already have or buy more shares.
Using our example of MGT, here are my conclusions:
- MGT’s stock price has increased significantly (60%) since the preliminary analysis was performed 5 months ago in February 2013.
- Unfortunately, since MGT’s EPS is/has been negative, we cannot calculate a margin of safety/sticker price to determine if the stock selling for a good price or not. Technically, since the EPS is negative, it has been and continues to be HIGHLY OVERVALUED.
- Even though several of the important financials for MGT are in fact “in the red,” the change trends over the past 1-3 years continue to point towards that the company is heading in the right direction.
- All three technical indicators dictate that now is NOT a good time to buy MGT shares.
- From a qualitative perspective, the company still has a great CEO, has made some very nice (and logical) investments in recent months to expand their business in to skill-based and sports-wagering, and has made good progress with selling off their medical holdings.
- Because of all these considerations, I would hold my current MGT shares and buy more when the 3 technical indicators mentioned above give the green light.
How about you all? What is your approach to periodically checking in on individual stocks for potential investment? How much of your money do you allocate to individual stocks vs. mutual funds?
Share your experiences by commenting below!
How Do You Analyze A Penny Stock?

If you’ve been reading MPFJ for a while, you’ve probably heard me mention before that I am not a big advocate of people investing large amounts of their own money in active management, either through the buying and selling of individual stocks yourself, following the advice of a newsletter, with the help of a “professional” investment advisor, or through an actively managed mutual fund.
Why do I shy away from large investments in individual stocks? Simple. Because the track record of individuals (even professionals) selecting individual stocks does not show proof positive that it is worth the cost involved. In fact, 70% of the stock professionals fail to beat out the market, so why would I think I can do this consistently?
Having said that, I do, however, think that analyzing individual stocks for investing using smaller amounts of play money is a fascinating exercise, and it’s something that I would like to believe in. I just haven’t seen proof that it can be done consistently in an efficient manner, but maybe someone will prove me wrong one day and cause me to switch from my current approach of passive investing using index mutual funds and ETFs.
Anyhow, recently, I received an email from a blog reader asking about how I analyze an individual penny stock and also what my thoughts were on the specific stock, PLC Medical Systems, Inc. (OTCQB symbol: PLCSF). Since other readers may also be curious of what approach I take to analyze a penny stock for potential investment (or not – using only very small amounts of play money of course!), I figured this would be a good topic for a blog post and to also answer the reader’s question at the same time.
Step 1 – 30,000 Foot Elevation View of the Company and Long-Term Price Performance
To get a very high level overview of the company, I first turn to Google, Reuters, and/or Yahoo Finance to simply look up the ticker symbol.
On these sites, I specifically am looking at 3 things – 1) the long-term price history, 2) the financials, and 3) the company overview/description. I also like to use Yahoo Finance for all of my historical pricing data when performing historical backtests.
Shown below are these three items for the stock that the reader wanted me to take a look at, PLCSF. From these screens, I can conclude the following things for this specific stock:
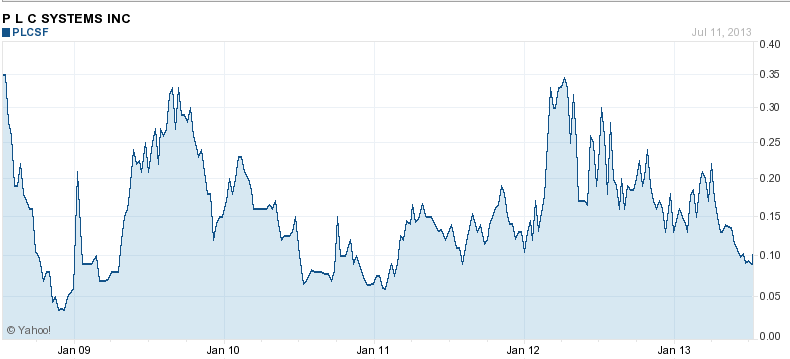
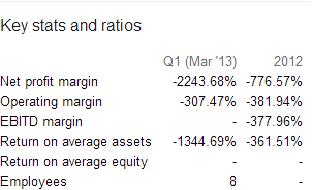
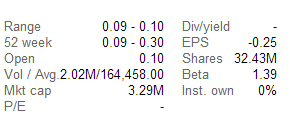
- Because of the low stock price per share (around 9-10 cents per share), low institutional ownership, low market cap (only $3.39 million, and horrible looking financials (margins and ROA in the negative hundred to thousands of percent range), this stock is an extremely speculative play, with a very high level of risk involved.
- In reading the general description provided, it is easy enough for me to understand what PLC Medical Systems does and what product(s) they offer as a medical device company.
- The company has been around for a long time now. In reading the company history, it was started back in 1987.
- From what I could tell, the company went public quite a long time ago (~10-20 years). However, it is hard to find readily available historical pricing data for this stock going back prior to 2008. I’m not sure if this is simply due to the fact that it’s a penny stock and isn’t covered as closely by Yahoo Finance and Google Finance, or if something else happened internally with the company between 2000-2008 that took the company public to private and then back public more recently. This will be something I would want to check on also.
- In addition, if the company has in fact been around so long, it makes me wonder why is their stock still only worth less than 10 cents per share?
- In looking at the price history graph below, the stock price has decreased 200-300% since 2008. During these 5 years or so, there have been 3 sharp downturns and 2 sharp upturns on the stock. The first downturn between 2008-2009 was likely associated with the overall market. However, I want to investigate why the company couldn’t sustain the 2 upward runs that it had in 2009 and again in 2012.
 |
| PLC Systems Long Term Stock Price History |
  |
| PLC Systems Financials |
 |
| PLC Systems Company Overview/Description |
Step 2 – See How the Stock Fits Within Phil Town’s Rule # 1 Investing Analysis System
As I mentioned previously in my 6 month test run of Phil Town’s Rule # 1 investing system (which showed that its usage did not deliver a market beating return due to the trading commissions involved), I do not believe that Phil’s system is the “magic formula” for beating the market. However, Phil’s approach does involve some very prudent technical and fundamental analysis which I feel can give me a deeper understanding of how the company would function as a potential investment.
- Phil Town Criteria # 1 – Only invest in companies that you would be proud to own, trade for > $1 per share, and have > 500,000 average daily trading volume. The type of companies you should invest in should be at the intersection of what you love to do, what you are good at doing, and what you can earn money doing.
- PLC Systems is trading for much less than $1 per share (9-10 cents per share) and only has an average daily trading volume of 164,000 shares, which means that it is not very liquid and also can swing many percentage points each trading day. In regards to these metrics, PLC would not qualify under Phil Town’s standards.
- Since PLC Systems Inc is involved in the medical field, I would be interested in owning the stock.
- Phil Town Criteria # 2 – Identify if the company has a “moat” – What he explains we are looking for here is >10% annual growth rate over 10 years for the following things: 1) Return on investment capital, 2) sales revenue, 3) EPS growth, 4) Equity per share, and 5) free cash flow growth. We also make sure that the company has enough current free cash flow to be able to pay back it’s long-term debt in 3 years or less.
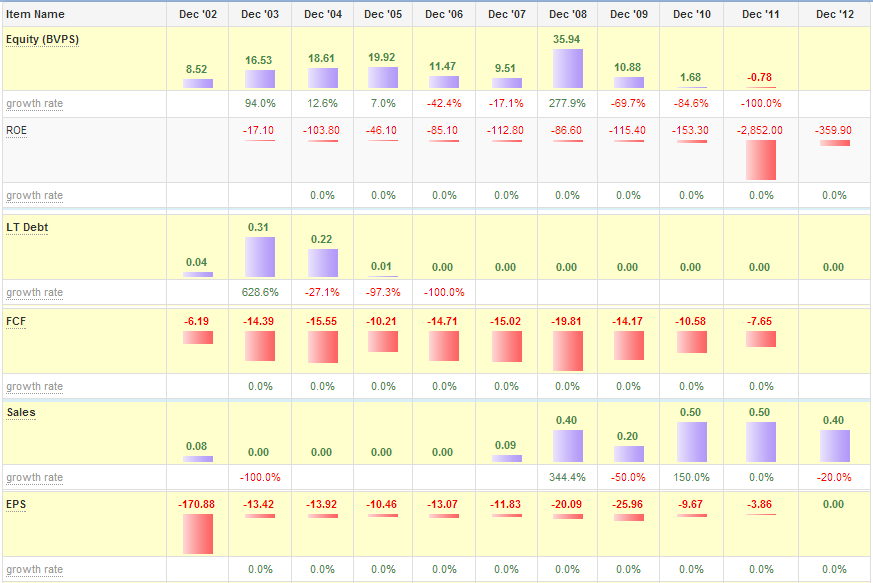
- A great place to get all of this 10 year historical data in one place is Stock2Own.com. If you type in the ticker symbol of the stock you’d like to analyze in the box at the top, it will then automatically display the 10 year data for these ratios. These can be accessed by clicking the Annual Statements option on the left sidebar. This data for the PLCSF stock is shown in the figure below:
- For PLCSF, unfortunately, the financial calculations above do not look very good because of all of the negative values it is carrying, and as such, are definitely NOT in line with Phil Town’s criteria. Return on investment capital, sales revenue, EPS, Equity per share, and free cash flow growth rates are all either deeply negative or zero. Furthermore, the company has negative free cash flow, but at the same time, they have no long-term debt.





Even though PLC does not meet the 10 % / 10 year average growth rate criteria set forth in the Phil Town method, this is not very surprising because as I mentioned above, it is expected to be a more speculative play (as a very cheap penny stock), not a rock solid, long term investment.
Because of this, we must also examine the actual financial figures shown in the bar graph above over the past ten years a little more in-depth.
As you can clearly see in the chart above, many of the numbers are negative, which is definitely a bad thing. Furthermore, if you examine the CHANGE TRENDS closely from left to right, it can be seen that the company does not really seem to be heading in the right direction since EPS, Book Value Per Share, and Free Cash Flow have all been steadily decreasing for the past 10 years or so. Although Sales and ROE have started to rebound only recently in the past 2-3 years, in my opinion, this does not take away the negative trends seen with EPS, FCF, and BVPS mentioned above.
- Phil Town Criteria # 3 – Calculate the appropriate sticker price, or what the stock should be selling at given it’s current EPS and EPS growth rate. We then calculate the Margin of Safety price (MOS) to make sure that we buy the stock at a significant enough (50%) discount to shield ourselves from mistakes and be able to achieve higher returns.
- Fortunately, the tool listed above, Stock2Own.com also has a handy feature that automatically calculates the sticker price (Value Price) and Margin of Safety (MOS) price.
- To view this in Stock2Own, simply click the Value Price option in the left sidebar.
- Unfortunately, for PLC, since their EPS is negative, a MOS/Value Price cannot be calculated, so we don’t have this gauging point to base our decisions off of.
- Phil Town Criteria # 4 – Use technical analysis tools to make sure you are either buying or selling at the right time. Phil recommends using three technical tools to make sure of this – 1) 8-17-9 MACD indicator, 2) 14K, 5D Slow Stochastic Oscillator, and the 3) 10-day moving average. Phil recommends that you only buy when all 3 of the tech. indicators say “buy.”
- To generate these three graphs for a stock analysis, I again use Google Finance. To set it up, you simply click, “Technicals,” at the bottom of any Google Finance stock price history window, and fill out the fields as shown in the below screenshot:
- Once you’ve set up the indicators, view the 3 month history graphs for the stock you’re analyzing. Three months seems to be a good time period in order to clearly see whether the technical indicators are saying “buy” or “sell.”
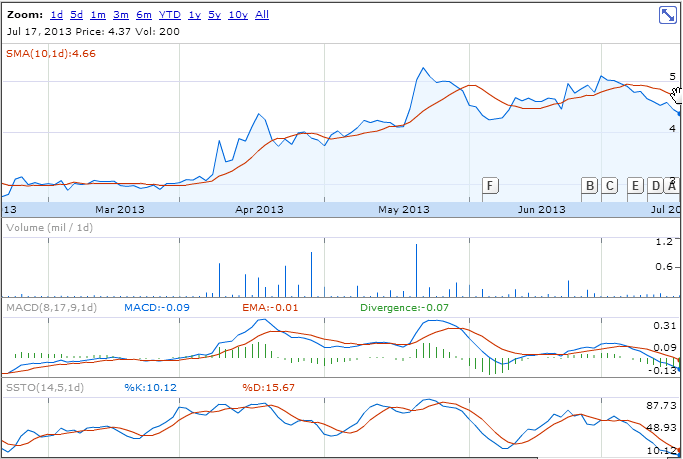
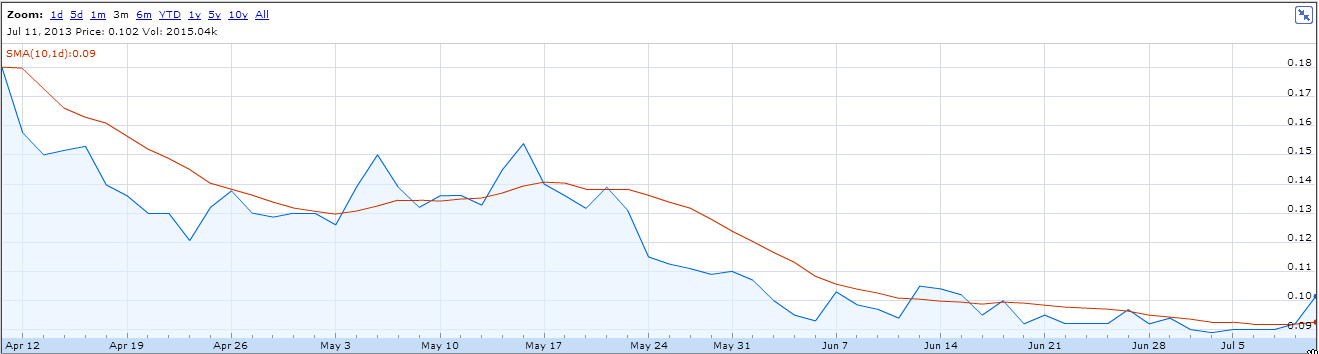
- For analyzing PLC, we’ll go through the technical indicators one by one. First, the 10 day simple moving average, as shown below (red line), compared to the actual stock price (blue line). With the simple moving average, a “buy” signal is indicated by when the stock price line crosses above the moving average. In the case of PLC, the stock price is currently above the moving average, indicating that we would want to buy right now.
- PLC’s 14K, 5D Slow Stochastic Oscillator is shown below. With stochastic, the K line (blue) is the “buy” line, and the D line (red) is the “sell” line. With this technical indicator, a “buy” signal is indicated by when the buy/K line crosses above the sell/D. In the case of PLC, the K line is currently above the D line, indicating that we would want to buy right now.

- PLC’s 8-17-9 MACD indicator is shown below. With this technical indicator, a “buy” signal is indicated by when the MACD line crosses above the EMA line. In the case of PLC, the MACD appears to be above the EMA, indicating that we would want to buy right now.

Step 3 – Qualitative Research on the Company, the Management (CEO Especially), Current News, and That No Insider Selling is Happening
As the title above suggests, the next step I take to analyze a company is to perform some qualitative research about what they do and how they do it. This is also a good time to research any questions that have popped up from the more quantitative investigations discussed above.
Listed below is how I tackle this step, using the stock, PLC, as an example:
- Management Analysis (done through Google Finance and Reuters.com) – The current CEO of PLC, Mark R. Tauscher, joined the company in 2000, bringing 20 years or sales/marketing (non-technical) experience in the medical device industry to the company. I performed an in-depth search around the Internet on Mark Tauscher and how he’s been doing as CEO of PLC Systems. I also reviewed several interviews he has done.
- Although he seems to be doing a “sufficient” job as CEO, I could not find anything mentioning that he has had a STELLAR impact on PLC or that he was a superb leader. Because of this, it makes me think that he isn’t the magnificent officer that would ideally be running the company with big hairy audacious goals!
- Insider Trading (done through company website or MSN Money) – In looking at the recent transactions of company insiders at PLC, it appears that there has been no activity (buying or selling) since several of the officers purchased shares back in 2009. In my opinion, this is probably not the best sign, since it may mean that the officers aren’t placing their own money in their personal efforts.
- It was interesting to read that recently, 3 large institutional investors have parked a great deal of money in PLC Systems, signifying that they are betting on it for the future.
- Additional Clarity About What the Company Does/Its Current Position (find the “news” columns on Reuters, Yahoo/Google Finance, etc after you bring up the chart for a specific stock) – On the PLC company website, I found a presentation from 2013 and a company fact-sheet that enabled me to learn a little more depth about what PLC does as well as what milestones and goals it is trying to accomplish.
- The company has only 1 product – RenalGuard.
- During heart procedures, a contrast dye is used to enable the doctor to see what he or she is doing. In 10-20% of the people having these procedures, they are at risk to developing toxicity to dyes.
- RenalGuard works to flush out these dyes from the patient’s system to prevent this toxicity from happening.
- In my opinion, this sounds like a great product – fairly easy to understand, answers an unmet need, and doesn’t really have any competition.
- The future success of the stock depends on receiving FDA approval for RenalGuard use in the USA. However, it looks promising that this will be obtained.
- Lastly, as I mentioned in my high level review, I had several questions about PLC’s stock price performance history.
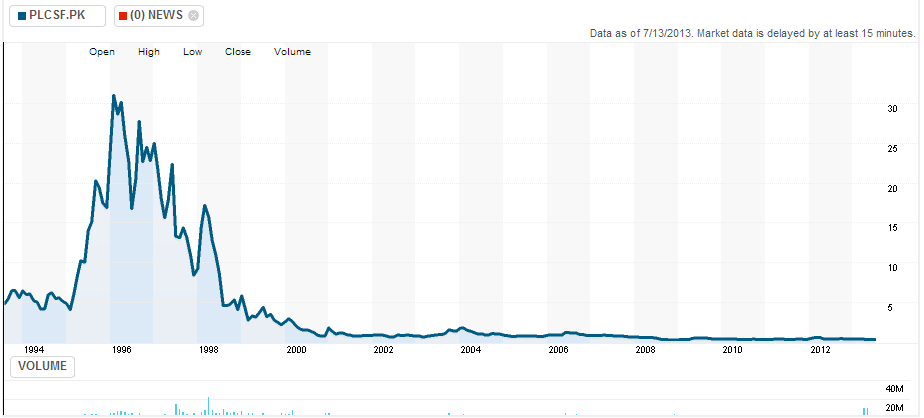
- On Reuters.com, I was lucky to find a more-lengthy stock price history for PLC Medical Systems (shown in the figure below).
- As you can see, from 1995-1996, the stock price ran up to the $30 per share range, which is quite incredible!
- And, ever since then, it has trickled along in the penny stock range.
- Unfortunately, despite extensive searching, I couldn’t find any articles or interviews explaining why PLC has been unable to increase it’s stock price during this 20 year period or so. Essentially, I wanted to know, “What makes the company different now that it is worth investing in compared to before when nothing happened?”
- To me, this is a fairly big red flag. It makes me
Step 4 – Review and Decision to Buy or Not
Having now completed all of the analysis, it’s now time to bring it all together, summarize the findings, and make a decision for if I would buy a specific stock using a very small amount of play money or not.
Using our example of PLC Systems, here are my conclusions:
- Seems like an understandable and good business model (now that I have performed a little more analysis).
- Even though the company only has one product, it answers a good unmet need and would have fairly little competition. Furthermore, it seems promising that it will receive FDA approval on the trial being conducted eventually.
- All 3 of the technical indicators dictate that NOW is a good time to buy shares of PLC.
- Even though the company’s product has potential, the CEO does not seem to be a “superstar.” I also was not satisfied with finding a compelling reason to invest in PLC Systems now compared to their past history when their stock has not gone anywhere since the 1990’s.
- Since the long-term financials are not very good and/or negative, the investment involves a lot of risk. In addition, it is not promising to see that most of the recent trends are still pointing downwards for PLC.
- Because of the items in red above, my final conclusion for this play is to NOT buy PLC Systems, symbol PLCSF right now.
- It may become a good play in the future, but until the financials are firmed up and the company story is more logical/compelling, I would hold off.
How about you all? What is your approach to analyzing individual penny stocks for potential investment? How much of your money do you allocate to individual stocks vs. mutual funds?
Share your experiences by commenting below!
Mid Year 2013 Current Asset Allocation and Net Worth Growth – January-June 2013

Hello there everyone! Jacob here! The past few months have been quite eventful, with starting to do animal trials for our Alzheimer’s disease therapeutics in graduate school, getting engaged, and now, with the awesome Tour de Personal Finance going on!
Anyhow, with 2013 now being half over, it’s time to review the progress on my net worth goals I’ve realized so far this year! So, without further ado, let’s get started – first with reviewing my net worth growth during the 1st half of 2013! As always, if you have any questions, please ask via email or commenting below!
As I’ve mentioned before, the goal of this running net worth and asset allocation progress update series is twofold:
- 1) To share how I (as a fairly normal non-financial professional) approach various financial issues that come at me throughout life so that you can use my learnings to assist you in your financial decision-making, and
- 2) To make me more accountable in sticking to my various financial goals that I set forth by periodically evaluating my status and making adjustments.
Overall, I would say that the 1st half of 2013 went amazingly well from a financial perspective. I’ve been able to make a lot of progress towards my personal, professional, and financial goals (even raised a total of $11,000 for the MS Society with my MS Bike Ride!). And, I’ve been able to invest significantly in to reaching my blogging goals with the help of several amazing staff writers on the site the past few months! On top of that, the overall market has been doing very well during the past 6 months!
With all of the up and down that has occurred, let’s take a look and see how it affected my net worth progress…shall we?
Liquid Net Worth Growth (Not Including Condo Nor Blog/Graduate Fellowship Unpaid Income Tax Savings)
In October of 2011, I had to make a fairly significant change in how I calculate my net worth and asset allocation percentages each month. The change pertained to the cash I consistently save up throughout the year in a high interest online savings account (Dollar Savings Direct) in order to pre-pay self-employed or unpaid (from my graduate research fellowship) income tax to the government in the form of quarterly tax payments. What was happening was that the balance in this tax savings account (which was being counted in to the cash portion of my asset allocation) was becoming too large, and it started to skew my asset allocation calculations.
To remedy this, since October of 2011, I’ve started using a system of calculating my liquid net worth, which includes all of my various equity and fixed income holdings but excludes 1) my equity and debt related to my condo and 2) the amount of savings I have accumulated so far during the year earmarked to pay the tax man. I’ve decided that doing the analysis in this fashion helps me remain more objective in making financial decisions without being influenced by assets that are needed for shorter-term living/tax expenses.
Keeping this important change in mind, let’s continue…
Overall Net Worth Growth
From 27-December-2012 (when the last portfolio update was computed – see link below for more information) to the beginning of July, 2013 the S&P 500 index increased 13.68%. Pretty awesome by any standard you think about really!
2nd Half of 2012 Portfolio and Net Worth
During that time period (January-June 2013), my liquid net worth (excluding condo ownership and unpaid tax savings) increased 14.54%, which seems just about right since I follow a passive investing approach.
Condo Equity Growth
I still currently have 19.88% home ownership in my condo, with this accounting for 16% of my real net worth (so net worth subtracting the condo loan – this is different from the net worth figure discussed above).
As I continue to learn more and more about advanced personal finance topics, I have become quite sure about one thing – I am not the biggest fan of aggressively building up as much home equity as is possible. While I am sure that home ownership is a great idea for personal finance success, I don’t believe that pre-paying a mortgage far beyond what is required is a very good investment. Why is this? Because the money that you pay over and beyond what is required (even though it is saving a little bit on interest, which is tax-deductible, so not really that much savings) is not gaining you any type of return whatsoever – it is essentially money stuffed under a mattress.
Instead, I have been taking the money I have leftover and maxing out my Roth IRA, then saving an equivalent amount in an after-tax account, and then using any that is then left over to contribute close to the maximum allowed for my Individual Roth 401k account.
Permanent Portfolio Performance Update
In November 2011, I became fascinated/interested enough in Harry Browne’s Permanent Portfolio asset allocation strategy in order to give it a small trial run with my own money (less than 1% of my liquid net worth). As such, I’ve decided (for fun!) to start tracking the performance of my small ETF version of the Permanent Portfolio in order to compare it to how the market is doing.
While holding the Permanent Portfolio from the end of December 2012 to the end of June 2013, the Permanent Portfolio decreased in value by 6.27%. During this same time period, the S&P 500 index increased by ~14%. So, looks like it did not perform better than the general equity market during this time period. However, one really cool thing I’ve noticed about this portfolio is that it is indeed very stable – with it never dropping or gaining more than 1% or so in any given month. So, just as Harry Browne predicted, eh?!
We’ll continue to keep an eye on this portfolio in 2013 and beyond. Should be interesting to see what happens!
Review of Current Asset Allocation (Excludes Condo and Tax Savings)
- Overall Fixed Income / Equity Allocation
- Currently, 34% of my net worth is invested in fixed income instruments (cash or bond funds), and 66% is invested in equity.
- This is 4% off from my targets for these categories of 30% (fixed income) and 70% (equity). So, it is still within my +/- 5% allowable band limits.
- Equity Allocation
- In the equity portion of my portfolio, 74% is invested in US Domestic Equities with the remaining 26% being held in international equities.
- This is within the tolerance banding limits of my equity breakdown targets of 70% and 30%, respectively, for US Domestic and international holdings. So, no action is needed at this time regarding this component of the analysis.
While the overall percentages for these categories look fairly good, a detailed look (table/listing below) at the allocation breakdown reveals the real story and provides for better analysis of the current state.
Remember: In order to maximize the benefits of your asset allocation strategy, a red flag goes off if your current % allocation in a category is greater than +/- 25% change from the target allocation. This is my trigger that I need to rebalance that aspect of my portfolio.
% Non-inflation Protected Bond Funds (target 12%) 13.81%
% TIPS Bonds (target 8%) 7.59%
% International Equity (Target 10%) 8.23%
% International Emerging Markets (Target 11%) 9.37%
% Domestic Large Cap (Target 7%) 6.97%
% Domestic Small Cap (Target 7%) 7.47%
% Domestic Small Cap Value (Target 13%) 13.11%
% Domestic Large Cap Value (Target 12%) 12.27%
% REIT (target 10%) 9.01%
Analyzing my current asset allocation percentages, it appears that my current asset allocation is aligned with my target levels within the +/- 25% band limits. Thus, no action is needed at this time.
My Next Moves For The 2H2013 Time Frame Will Be To Do The Following:
- Begin saving for the 2014 Tour de Vine National MS Society Fundraising event.
- Next year, I’ll again be looking to contribute 5-10% of my annual income to the bike MS event that I do each year.
- Thus, I’ll be looking to get an early start on saving the cash for this (using automatic monthly bank transfers to my ING Direct savings account) starting in August 2013.
- Use my 1% home value home maintenance fund to fix various small things that are broken around my condo after 3 years of use.
- These things include a closet door off the hinges, the light-switch in the bathroom not working all the time, the towel rack in the bathroom needing to be re-attached, and some pipes under the sink that need to be re-caulked. Once I get these things repaired, I will then need to replenish the depleted funds in the home maintenance account.
- Set up and contribute to an Individual Roth 401k Account with Vanguard.
- I added a new financial goal added during the 1st half of 2013 to continue building, optimizing, and balancing a Three-Legged Stool for Retirement
- Since I am in the 15% tax bracket, I first maxed out my Roth IRA for 2013. My next move has been to contribute an equivalent amount in an after-tax investment account in order to have money that is accessible for needs prior to retirement.
- Now that I have completed that, I am going to work towards contributing to a Roth Individual 401k with Vanguard.
- However, I hit a small hitch when I was notified by Emily at Evolving PF (a big thanks for the heads up by the way!) that I actually cannot count my graduate fellowship income as “earned income” for Roth IRA contribution purposes. This was quite shocking because I still have to pay all the taxes on it, but since the income is not reported on a W2, I cannot count it as income I can save for retirement. In order to read all of the details, check out Emily’s great post here.
- Nevertheless, this leaves me with having to count on my self-employment income as the only “earned income” I can utilize for retirement savings / contributions. Because of this, I’ll have to make sure that my self-employed income (minus the tax-deductible portion for self employment tax) gets high enough this year to cover both 1) my Roth IRA contributions which I have already maxed out and 2) any contributions I want to make my Roth 401k before starting to contribute to my Roth 401k!
- It’s important to note that with Individual 401k’s, even though you can make contributions for a certain tax year up until the April tax deadline, you must have the account open by December 31st of the year you want to make the contributions for.
- Since adding a Roth 401k component to my Individual 401k technically counts as a “new account,” I will need to make sure to have the Roth 401k portion set up before the end of this year, even if that means only funding it with $1k (which is the minimum required by the Vanguard STAR Fund, the fund that Vanguard offers with the lowest possible required minimum contribution).
Wish List
- At some point, purchase the Vanguard Total Stock Mkt Idx (MUTF:VTSMX) to replace S&P 500 index fund, whenever more money is needed to increase my domestic large cap asset class holdings. This gives better, broader diversification to the US stock market.
How about you all? How did you progress with your net worth in the January-June 2013 time-frame? What are your thoughts about the strength of the market right now?
What financial challenges are you currently facing?
Share your experiences by commenting below!